Imagine that you are a taxi driver deftly navigating busy city streets to get your passenger to the airport on time and to prove that taxis remain relevant in a changing world of Uber and Lyft. If you had a choice of routes would you opt for a well-lit route with excellent visibility versus a route where some of the street lights were out and visibility is a challenge? Using this analogy, if you are part of a DevOps team focused on delivering business outcomes (orders, trades etc..) using Application Performance Monitoring (APM), can you afford to have your SAN infrastructure and shared networked storage remain in the dark while only the applications and servers are lit up?

Application Performance Monitoring tools like AppDynamics monitor business transactions as they move through a custom application written using Java or .Net and establish dynamic baselines. AppDynamics can track every line of code and initiate deep diagnostics if performance wavers. AppDynamics can also monitor servers (CPU & disk utilization, memory consumption) and databases (performance metrics like resource consumption, database objects, schema statistics). Using APM, business owners can now focus on revenue and conversion rates rather than focus on application performance issues alone.
However, if you have 1000 applications you might license and instrument APM to monitor 10% of them – only the business-critical applications. For budgetary reasons, you wouldn’t have APM instrumented for the remaining 90% of applications which may be tier 2 and tier 3 and may include commercial off-the-shelf applications like Backup or Authentication where code-level visibility is not of much value. While APM monitors applications, virtual servers, and databases, it simply can’t see the underlying SAN or storage infrastructure. However, this shared SAN infrastructure could be used by a noisy neighbor application which adversely impacts the SLA of a tier 0/1 application.
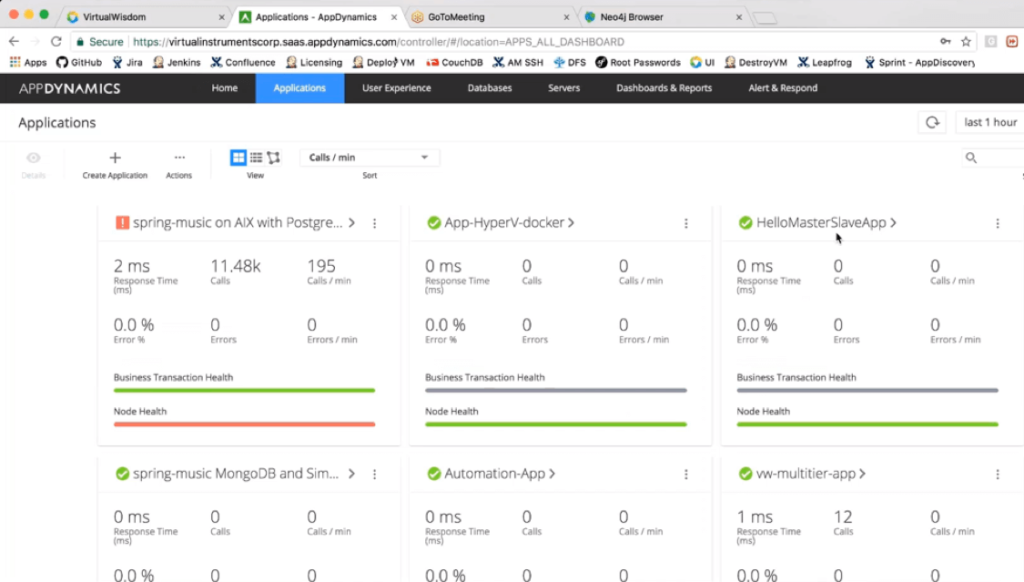
An infrastructure monitoring platform like Virtana Infrastructure Performance Management monitors the entire stack – from the host or VM down to the HBA port, SAN fabric and ports on your networked storage array. Recently Virtana IPM added support for application discovery using AppDynamics. Virtana IPM can connect to the AppDynamics controller and imports known applications. If you log into the AppDynamics controller you may see applications like the ones shown below.
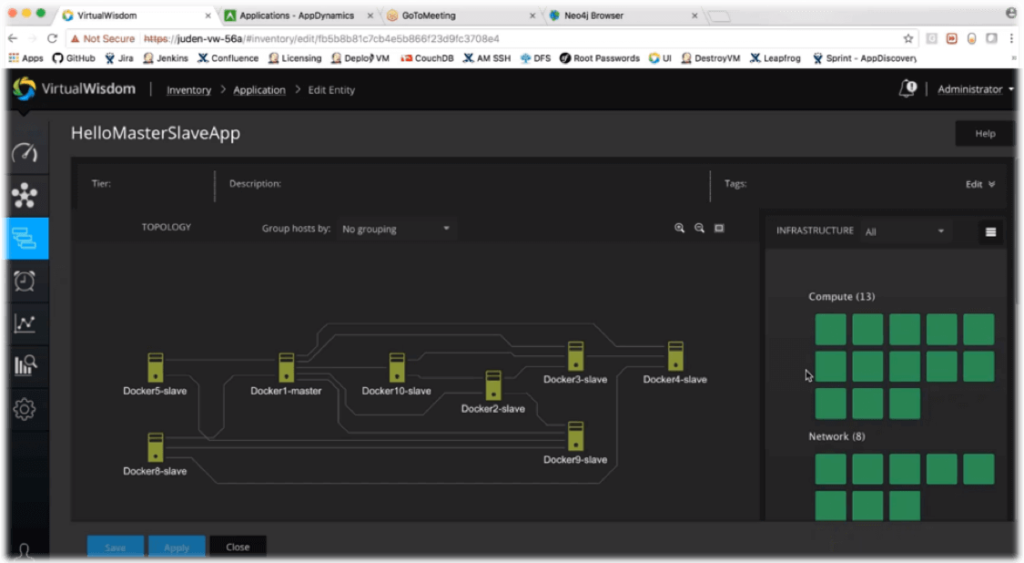
Since Virtana IPM has already discovered hosts and the underlying storage infrastructure, after importing applications from the AppDynamics controller you can now see the application and its related infrastructure in our GUI.
Assume that HelloMasterSlaveApp happened to be a tier 0 application with an SLA requirement that latency stay below 5 msec. In Virtana IPM you would set a best-practice alarm that triggers if the latency goes above 5 msec for say 5 min. When the alarm fires, it creates a Case and a guided investigation, which in turn recommends the analytics Event Advisor & Trend Matcher you would need to run to find root-case.
Event Advisor shows you what other abnormal events occurred in the shared infrastructure at the time when the tier 0 application experienced over 5 msec of latency. Trend Matcher then goes on to determine root cause of that spike in latency. Trend Matcher may show you the %age of time when say port 0 and port 10 on your networked storage spiked simultaneously. It may overlay another curve on this graph to show you that a certain VM101 had unduly high MB/second at this same time. Based on this visualization you could conclude that VM101 was the culprit flooding a storage port on the array with its I/O while this port was also being used by your tier 0 application. It is worth noting that VM101 may not be monitored by AppDynamics nevertheless it is impacting your tier 0 application. This is a very common scenario.
Virtana IPM goes beyond just identifying VM101 as the noisy neighbor. We provide options to remedy this noisy neighbor at the infrastructure level:
- Run our Storage Port Balancer analytic to rebalance the workload so that a single storage port is not overly impacted.
- Use our Queue Solver analytic to throttle I/O from VM 101.
The result of either of these two remediation methods is that you are back to meeting your 5 msec response time SLA for your tier 0 app. In summary, Virtana IPM tag teams with AppDynamics to ensure that you have visibility into the entire software stack – from your application down to the storage LUN and as a result, your business outcomes are met.
James Bettencourt