

Monitoring Tool Consolidation
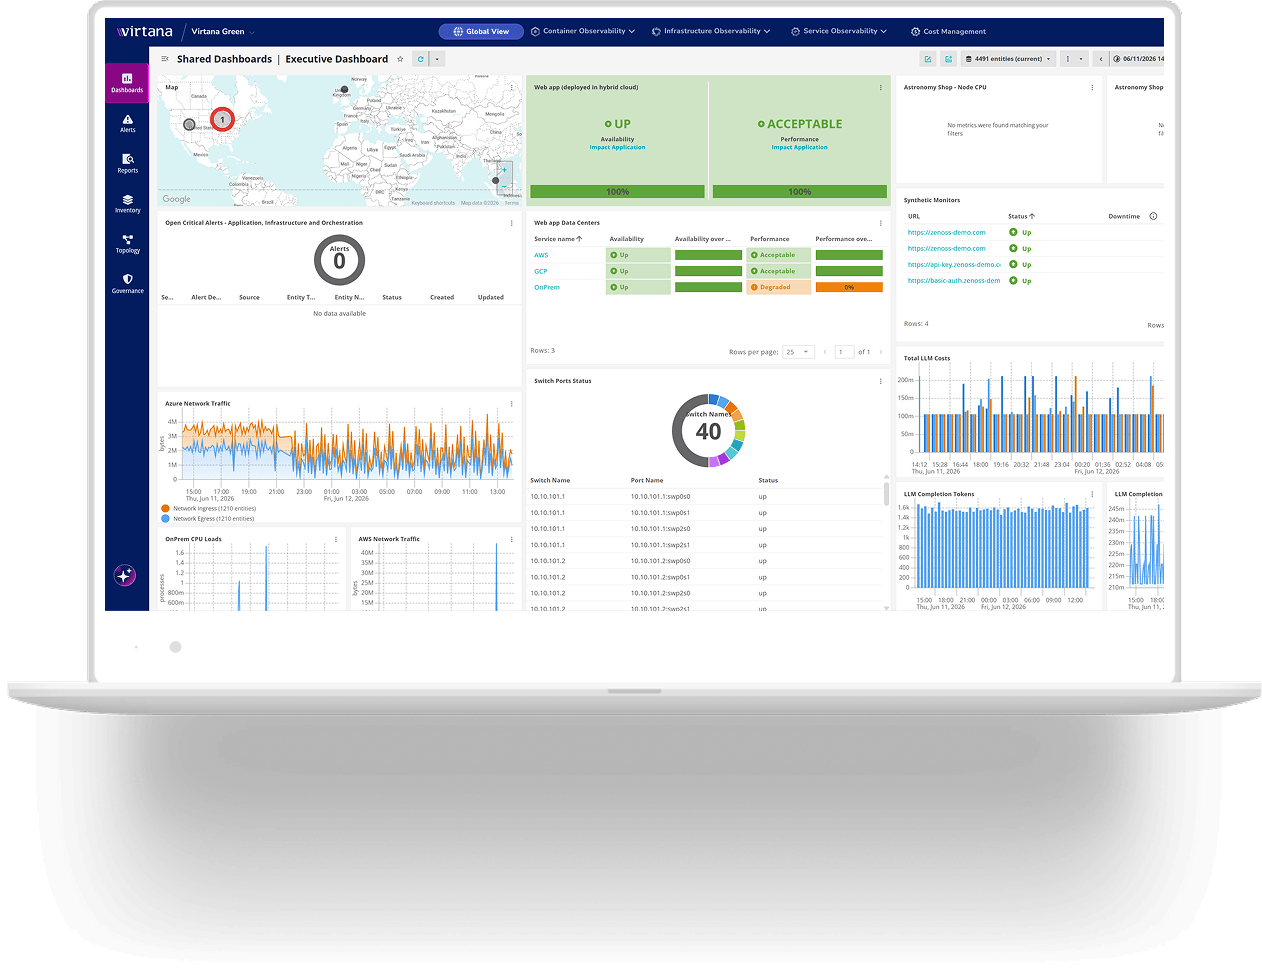
Monitoring consolidation gets harder when enterprises accumulate NPM, APM, infrastructure, cloud, container, log, and FinOps tools. Each tool sees part of the environment, but critical dependencies still fall between domains.
Virtana consolidates monitoring into a system-aware agentic observability platform with dependency context, AI-driven intelligence, and automated remediation.
‘Virtana Has Given Us the Ability to Detect, Troubleshoot, and Correct Payment-Impacting Issues Within Minutes’
– Slade Weaver, Senior Manager, Core Data Platform, PayPal
Hybrid Infrastructure Observability
See Across Every Monitoring Domain in One Platform
Fragmented monitoring pushes teams to inspect symptoms by domain. NPM tools show packets, APM shows traces, infrastructure tools show utilization, and FinOps shows spend.
Consolidating these domains with meaningful insights and actionable intelligence is the foundation for system-aware observability and system-level context.
Virtana’s Infrastructure Observability connects telemetry across compute, storage, network, data fabric, services, applications, and AI workloads. Teams see how on-premises, public cloud, and Kubernetes signals relate within a single platform.
Manual correlation across siloed teams in war rooms, which would take hours or days, is reduced to minutes with AI-driven, automated root cause analysis.
Instead of reconciling disconnected views, teams work from a full-stack context across the systems that deliver modern applications.

Unified Monitoring Across Tools
Replace Fragmented Alerts With AI-Driven Correlation
Consolidation only pays off when correlation is automated at enterprise scale.
Conversely, disconnected data only exacerbates system-dependency blind spots when
applied at machine scale.
With network observability, Virtana analyzes signals across consolidated domains. Agentic AI identifies likely root causes, underlying constraints, and affected dependencies.
Teams can detect latency spikes, congestion, storage delays, packet loss, and resource contention across platforms. That reduces alert noise, limits war rooms, and helps MTTR improve.
System Dependency Mapping
Map Cross-Tool Dependencies With a Single System Dependency Graph
Monitoring consolidation stalls when dependency data stays scattered. Point tools may know their domain, but not the connected delivery system.
Virtana’s System Dependency Graph uses dependency mapping to discover relationships across applications, services, containers, cloud resources,network paths, and storage. It keeps the topology current as workloads move, demand changes with autoscaling, or teams update configurations.
Teams can see how incidents, migrations, and scaling events affect downstream services. That replaces manual tracing and static CMDB assumptions with a shared operational map.
Because the graph reflects live relationships, teams can evaluate the risk of change before execution. They can see impacted services before a migration, scale-out, or configuration update.
Performance, Capacity, and Cost Optimization
Consolidate Optimization Decisions Onto a Single Platform
Performance, capacity, and cost decisions suffer when each team uses separate evidence. A FinOps report may identify waste without showing service risk. A capacity tool may show growth without dependency context.
Virtana connects cloud capacity management with operational telemetry and cross-layer dependencies. Teams can identify bandwidth saturation, capacity exhaustion, and resource contention before SLAs are breached.
Agentic AI applies predictive analytics and constraint-based optimization across hybrid environments and AI workloads. That helps reduce monitoring TCO while improving utilization across multi-cloud operations.
The result is more defensible planning across technical and financial teams. Capacity decisions can reflect performance needs, workload placement, and downstream service exposure.

Enterprise-Scale Monitoring Consolidation
Built for the Scale and Complexity of Hybrid Enterprise Environments
Enterprise consolidation requires coverage beyond cloud-native services or small environment assumptions. Virtana supports hybrid infrastructure, multi-cloud, Kubernetes, AI infrastructure, VMware, and Nutanix at scale.
With AI Factory Observability, teams extend consolidated monitoring to GPU clusters, model pipelines, and AI workload infrastructure. Automation helps standardize common operational workflows and remediation across large environments.
That matters during modernization, when tools, services, and workloads change quickly. Teams can consolidate without losing the dependency context needed for safe growth.
Monitoring consolidation reduces tool count but leaves teams rebuilding context during every incident. Virtana is designed to keep that context connected as environments expand.
Why Virtana for Monitoring Consolidation
Observe. Triage. Remediate. Virtana helps enterprises consolidate monitoring without flattening the system context teams need.
Application Observabilityconnects application behavior to infrastructure, network, storage, cloud, Kubernetes, and AI systems. This makes the consolidation of siloed telemetry into meaningful insights and actionable intelligence.
- See the Full Stack: Bring infrastructure, application, network, storage, cloud, Kubernetes, and AI signals into one platform.
- Understand Cause and Effect: A System Dependency Graph reveals relationships that monitoring tools often miss.
- Correlate With AI: Agentic AI identifies likely causes, emerging constraints, and affected dependencies across consolidated domains.
- Automate the Next Step: AI-driven intelligence connects to remediation workflows, reducing manual handoffs during incidents.
- Consolidate Without Narrowing Coverage: Infrastructure, Application, and AI Factory Observability work together on a single platform.
- Reduce Operational Overhead: Replace multiple monitoring contracts while increasing system-level context and dependency awareness.
For BOFU buyers, that balance matters. Consolidation should lower TCO and improve operational confidence. Virtana helps teams rationalize tools while strengthening root cause analysis, service assurance, and modernization readiness.
Resources
Use these resources to evaluate monitoring consolidation across infrastructure, applications, and hybrid cloud operations.
- Compute Observability for Enterprise Servers: Evaluate visibility into enterprise servers across hybrid infrastructure, including performance, health, and utilization signals.
- Single Pane of Glass Monitoring: Explore centralized visibility for hybrid and multi-cloud environments, with operational context across teams.
- Application Observability: Connect consolidated monitoring to application-layer behavior, service impact, and infrastructure dependencies.
Integrations for Hybrid and Multi-Cloud Environments
Virtana supports the environments enterprise teams depend on most.
Trusted by Enterprise Teams

FAQs
Monitoring consolidation replaces fragmented, domain-specific tools with a single observability platform. Those tools may include NPM, APM, infrastructure, cloud, container, and log monitoring.
Effective consolidation should do more than remove dashboards. It should unify telemetry, retain dependency context, and add intelligence across hybrid and multi-cloud environments. That helps teams reduce tool sprawl while improving system-level understanding.
Monitoring tool sprawl happens when teams add NPM, APM, log, infrastructure, cloud, container, and FinOps tools in parallel. Each tool solves a local need, but the stack becomes harder to operate.
The result is fragmented visibility, manual investigation, alert noise, rising licensing, and slower root cause analysis. Modernization and AI workloads often expose these gaps, making consolidation a business priority.
Do not consolidate by replacing many specialized tools with one shallow dashboard. The safer goal is preserving system context while reducing fragmentation.
Look for a platform that retains domain depth across applications, infrastructure, networks, storage, Kubernetes, cloud services, and AI workloads.
Virtana consolidates monitoring into a system-aware, agentic observability platform spanning compute, storage, network, applications, containers, and AI workloads.
Dependency context, AI-driven correlation, and automated remediation make that visibility usable during incidents. Teams keep the evidence needed to prove root cause, not just observe symptoms.
Enterprise buyers should evaluate breadth, depth, and automation. The platform should cover infrastructure, applications, networking, storage, containers, and AI workloads within a single architecture. It should support AWS, Azure, Google Cloud, VMware, Nutanix, and Kubernetes.
It should also provide full-stack dependency context through System Dependency Graph and topology discovery.
AI-driven root cause analysis and automated remediation matter too. Teams need to act on consolidated telemetry rather than managing another alert layer. Strong platforms should also support decisions on capacity, cost, and change risk.
Virtana replaces fragmented NPM, APM, infrastructure, cloud, container, and log monitoring tools with a single system-aware, agentic observability platform. The Infrastructure, Application, and AI Factory Observability modules provide enterprise teams with breadth without sacrificing domain depth.
The System Dependency Graph and AI-driven correlation provide the context needed for faster root cause analysis. Automated remediation helps lower operational effort and monitoring TCO. Teams can consolidate contracts, workflows, and investigations without sacrificing visibility into hybrid infrastructure.
APM platforms are valuable for application telemetry, but Virtana starts with the full delivery system. It maps relationships across applications, infrastructure, storage, networks, cloud services, Kubernetes, and AI environments. That helps teams identify constraints and prove root cause across hybrid dependencies.
Agentic APM solutions are only as intelligent as the fragmented, siloed telemetry they rely upon. Virtana’s Agentic Observability Platform provides full, system-level context for automated root cause analysis.
Virtana is designed for enterprise estates spanning on-premises, multi-cloud, VMware, Nutanix, and Kubernetes. It is not limited to cloud-native application views.