Enterprise Network Monitoring Tools
Enterprise network monitoring gets harder as traffic moves across data centers, cloud networks, Kubernetes clusters, SD-WAN connections, and AI infrastructure.
Teams struggle to correlate latency, packet loss, congestion, and dependency failures across increasingly distributed environments.
When teams can’t connect network behavior to application slowdowns, Kubernetes service degradation, cloud connectivity issues, or storage latency, troubleshooting slows, outages last longer, and operational costs increase.
Virtana gives you enterprise network monitoring software with full infrastructure context.
You can see where the network is the constraint, understand downstream impact, and act faster across hybrid and multi-cloud environments.
“What Took Months Took About Twenty Minutes [With Virtana].”
A Fortune 100 enterprise migrated 20,000 virtual machines in under 11 months. They standardized their infrastructure on Nutanix.
Virtana made Nutanix operational at scale. The results?
- Migrated 20,000+ workloads to Nutanix
- Rebuilt 1,700 hosts
- Optimized placement across 200 Nutanix clusters
- Delivered with a team of 12 engineers
- Maintained continuous operations with zero disruption
- Reduced infrastructure decision-making from months to minutes

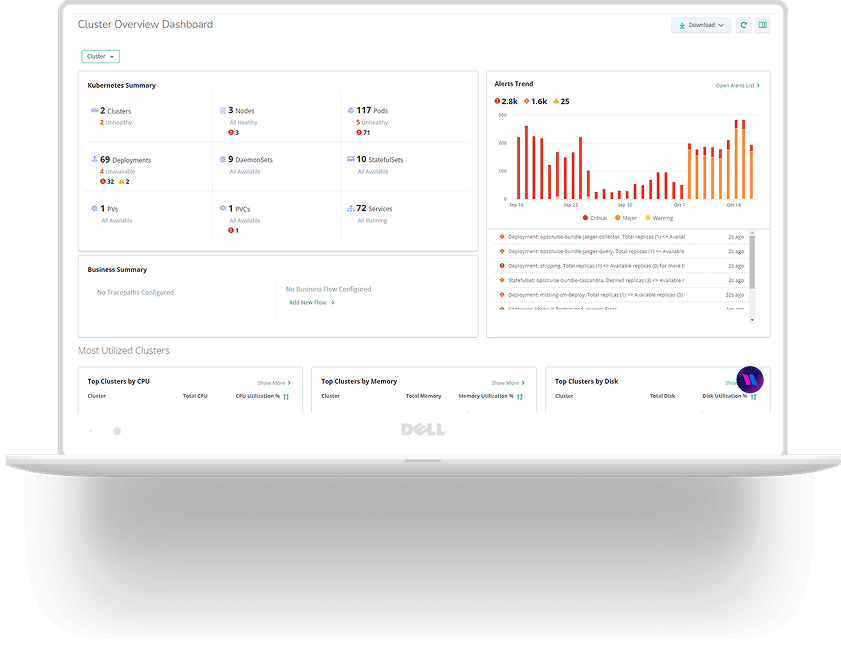
Hybrid Infrastructure Observability
See Network Performance in Full Infrastructure Context
Network issues rarely stay isolated to routers and switches.
They impact application response times, Kubernetes workloads, east-west traffic, storage access, cloud interconnects, and shared infrastructure across hybrid environments.
Virtana helps teams correlate network behavior with application latency, infrastructure contention, failed service dependencies, and the impact on user experience in real time.
You can connect signals across compute, storage, network, data fabric, services, and AI workloads.
This is where hybrid infrastructure observability becomes valuable. You get a clearer view of performance across hybrid systems rather than chasing isolated symptoms.

Network Performance Monitoring
Identify Bottlenecks Faster Using Agentic AI
Enterprise monitoring breaks down when teams work across disconnected tools. Alerts pile up. Context gets lost. Investigations stretch across teams.
Virtana helps you move faster by detecting performance issues across complex environments and surfaces, and identifying likely causes sooner. AI-powered event correlation and root cause analysis reduce manual investigation time.
Your team spends less time stitching together data and more time resolving the issue. With network performance monitoring, you can:
- Detect latency spikes, congestion, packet loss, and dependency failures across hybrid and multi-cloud environments
- Reduce manual investigation across network monitoring, cloud observability, Kubernetes, and infrastructure tools
- Understand whether bottlenecks originate in the network, compute, storage, virtualization, or application layer
- Use AI-driven correlation and automation to reduce MTTR and accelerate root cause analysis

Enterprise Dependency Mapping
Understand System Dependencies Across the Environment With a System Dependency Graph
When latency, routing instability, DNS failures, or cloud connectivity issues occur, the hardest part is understanding which applications, services, clusters, and workloads are affected downstream.
Virtana gives you that relationship visibility. A real-time system dependency graph helps teams visualize relationships between applications, Kubernetes services, cloud resources, network paths, and infrastructure dependencies. As the environment changes, dependency maps update in real time.
That shared view improves coordination during investigations. Application, infrastructure, and cloud teams can work from the same context.
Dependency mapping helps you:
- Map relationships between connected systems
- Understand the downstream impact before making changes
- Improve cross-team visibility during incident response
- Keep dependency data current through AI-driven discovery

Enterprise Infrastructure Optimization
Optimize Performance, Capacity, and Cost
Enterprise network monitoring tools should support better operating decisions. They should help you improve utilization, plan capacity, and control waste.
Virtana ties network visibility to broader infrastructure outcomes. You can identify bandwidth saturation, inefficient traffic patterns, infrastructure hot spots, and resource contention to improve workload placement, capacity planning, and operational efficiency.
Predictive analytics help teams anticipate network congestion, capacity exhaustion, infrastructure saturation, and performance degradation before they impact critical business services.
For teams running dense, distributed environments, hyperconverged infrastructure visibility adds another layer of operational control.

Enterprise Infrastructure Management
Built for Complex Enterprise Environments
Virtana is built for the environments enterprise teams actually run. That includes hybrid infrastructure, multi-cloud networking, Kubernetes environments, AI infrastructure, virtualized workloads, and large-scale enterprise operations that constantly change as services move across environments.
Virtana supports common operational workflows with more automation and less manual effort. That matters when your team is expected to move quickly across a broad and distributed footprint.

Why Virtana for Enterprise Network Monitoring
Virtana is a stronger fit for enterprise network monitoring because it provides more than just device-level visibility. You get:
- Broader visibility across hybrid infrastructure, cloud networks, Kubernetes environments, and distributed application architectures
- Deeper dependency awareness across applications, services, network paths, storage, and infrastructure systems
- Support for enterprise-scale complexity
- AI-driven intelligence and automated remediation
- Faster identification of root cause across complex distributed systems
That combination helps you determine when the network is the constraint, rather than relying on incomplete signals from narrower enterprise network tools.
Resources
Compute Observability for Enterprise Servers
See how Virtana extends observability into the compute layer for better infrastructure troubleshooting and planning.
Single Pane of Glass Monitoring
Get a centralized operational view across hybrid infrastructure, with better visibility into health, trends, and performance.
Connect network behavior to service performance so your team can investigate issues in a full system context.
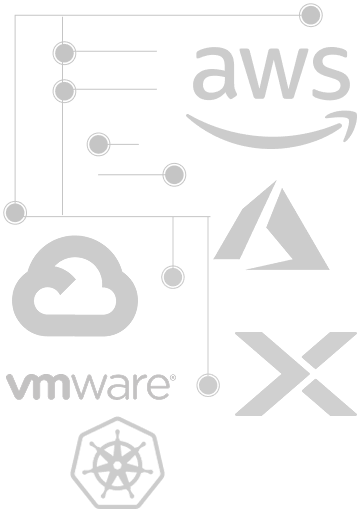
Integrations for Hybrid and Multi-Cloud Environments
Virtana supports the environments enterprise teams depend on most.
- Amazon Web Services (AWS): Monitor cloud networking performance, hybrid connectivity, inter-region traffic, and workload communication across AWS environments
- Microsoft Azure: Correlate Azure network latency, virtual network behavior, and infrastructure performance with downstream application impact
- Google Cloud: Extend observability across multi-cloud networking, distributed workloads, and cross-platform infrastructure dependencies
- VMware vSphere: Understand how network behavior affects virtualized workloads and shared infrastructure
- Nutanix: Support large-scale modernization, migration, and workload placement decisions
- Kubernetes: Correlate container networking, Kubernetes service communication, cluster behavior, and infrastructure dependencies
Trusted by Enterprise Teams

FAQs
Enterprise network monitoring is the practice of tracking network health, latency, packet loss, bandwidth utilization, and service dependencies across large, business-critical environments. It helps teams understand how network behavior affects services, infrastructure, and user experience.
Hybrid environments create fragmented visibility. Teams have to manage on-premises systems, cloud platforms, containers, and shared infrastructure simultaneously. Dependencies become harder to trace across cloud networks, Kubernetes clusters, SD-WAN architectures, and distributed applications when telemetry is fragmented across separate tools.
Virtana correlates network behavior with application, infrastructure, and workload context. That helps teams isolate likely causes faster and reduce manual troubleshooting. AI-powered analysis also helps cut through alert noise and focus investigations.
Yes. Virtana helps teams manage change across migrations, infrastructure upgrades, and evolving hybrid environments. With clearer visibility into dependencies, you can make changes with greater confidence and reduce operational risk.
Traditional network monitoring tools often focus on device metrics, SNMP polling, and isolated alerts, without understanding the downstream impact on applications or infrastructure. Virtana brings a broader infrastructure context, awareness of dependencies, and deeper operational intelligence. That helps enterprise teams understand how network issues affect the wider system.
Enterprise network monitoring has moved far beyond siloed, device-level visibility. Today’s environments span hybrid infrastructure, multi-cloud platforms, Kubernetes, and AI-driven workloads. Teams need full infrastructure context, awareness of dependencies, and faster root-cause analysis to keep up with the scale and complexity.