Virtana breaks the old definition of an application by observing the end-to-end system behind every service with deeper performance management, not just the code.
Distributed Tracing Tools
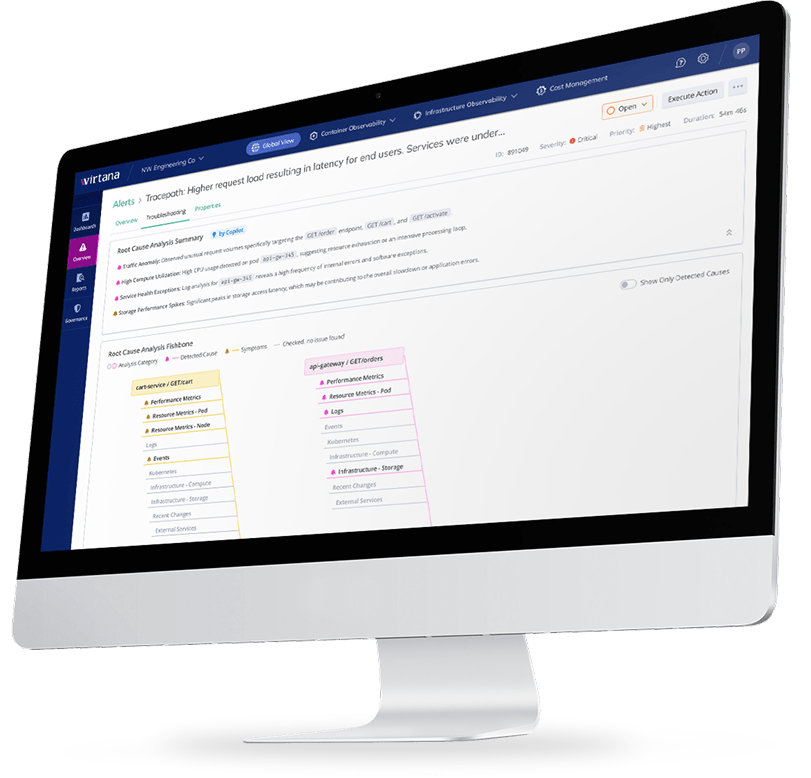
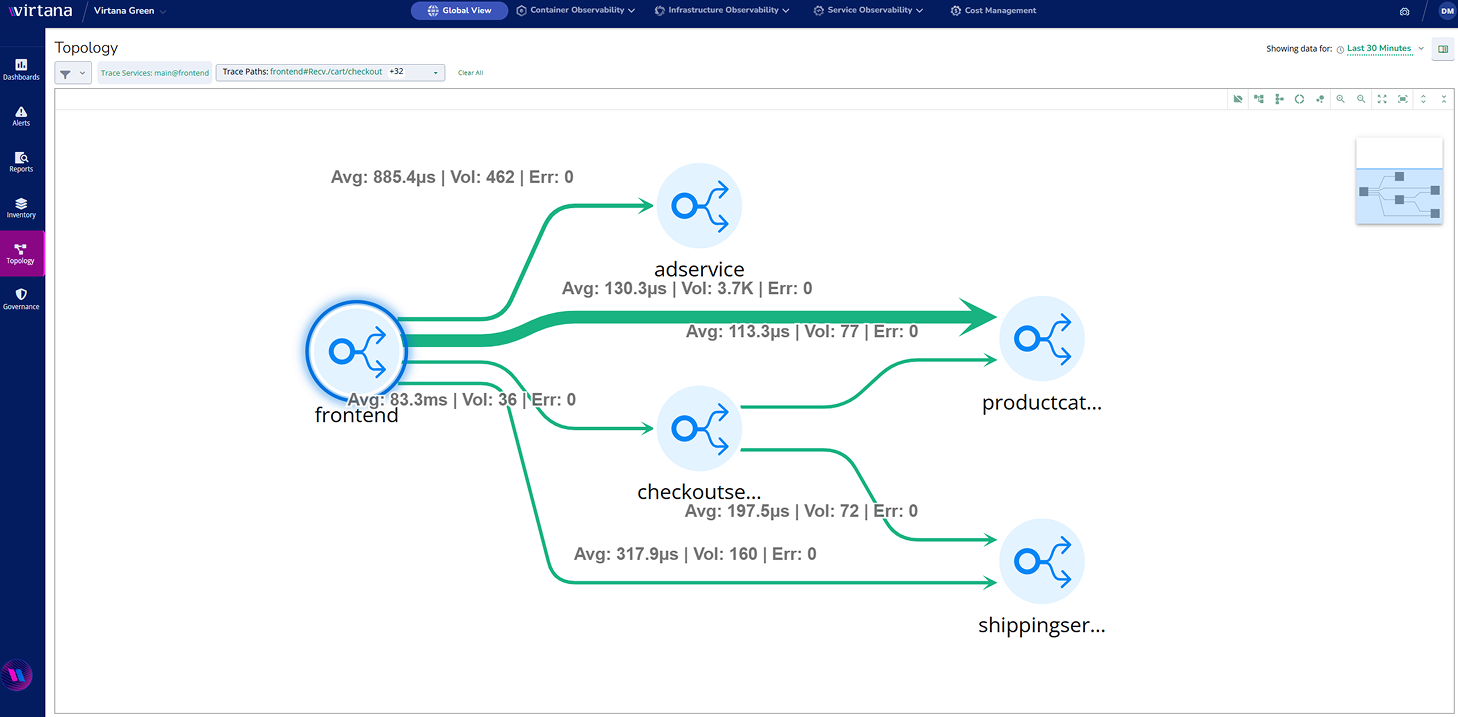
Business Transaction and Trace Observability
- Trace business transactions end-to-end across services, clusters, nodes, storage, and network paths to enable real-time performance management across the full delivery system.
- Identify where time is actually spent and which dependency drives user impact.
- Prioritize fixes by tying trace behavior to business impact and service health.
Container Monitoring Tools
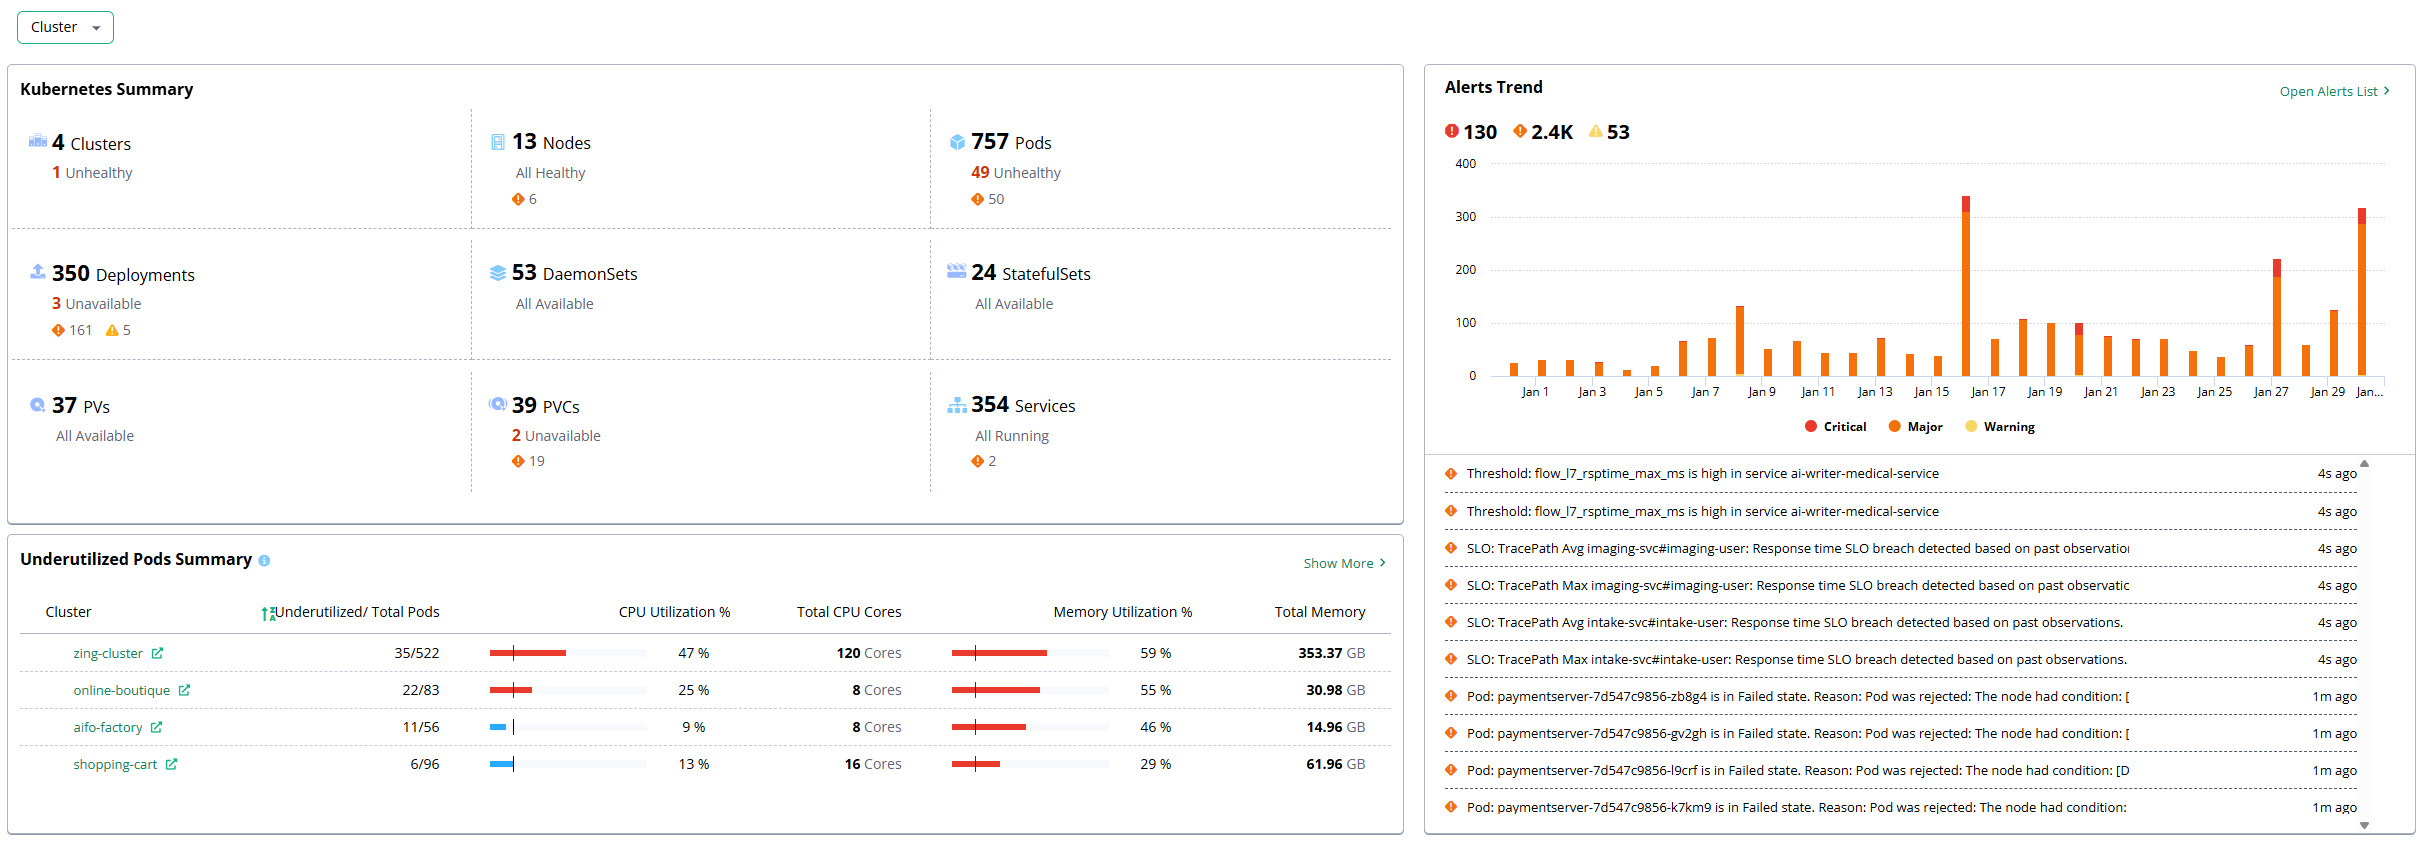
Kubernetes Observability
- Map services to the Kubernetes resources and runtime dependencies that govern performance.
- Spot contention and instability that traces alone cannot explain, including noisy neighbors and throttling.
- Connect pod and node conditions to the transactions they disrupt.
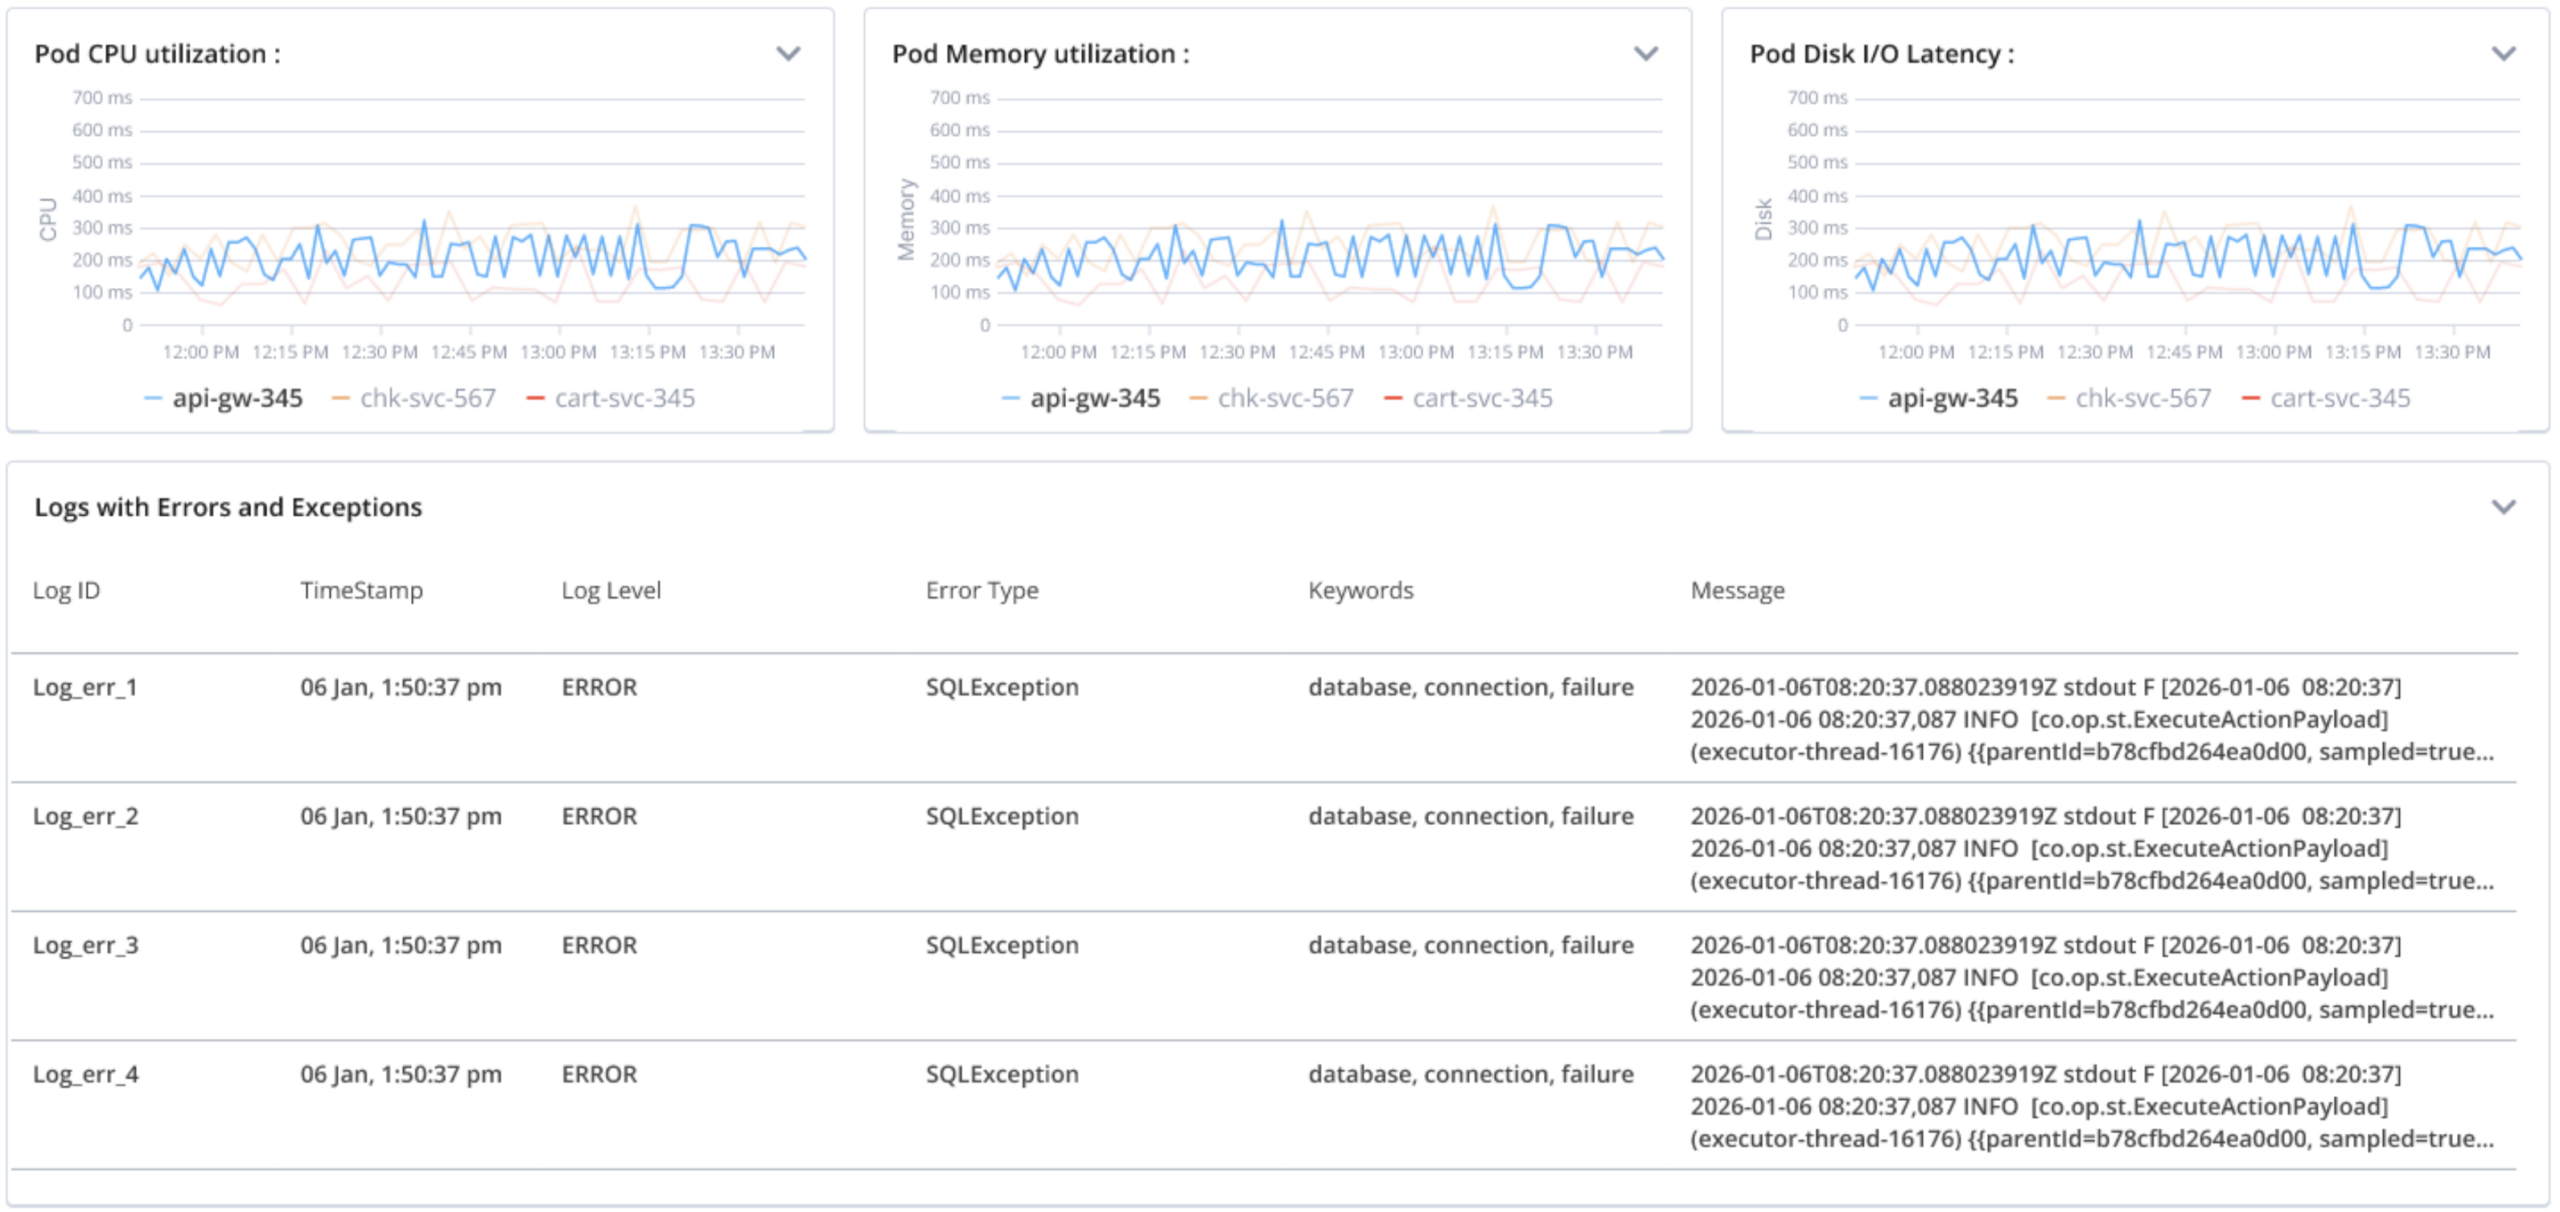
Log Analysis Software
Log Analysis and Correlation
- Correlate log events with traces, alerts, and dependency context to pinpoint the failure chain.
- Reduce false positives by clustering related issues into one coherent incident story.
- Accelerate resolution by identifying the most relevant log signals for the impacted transaction.
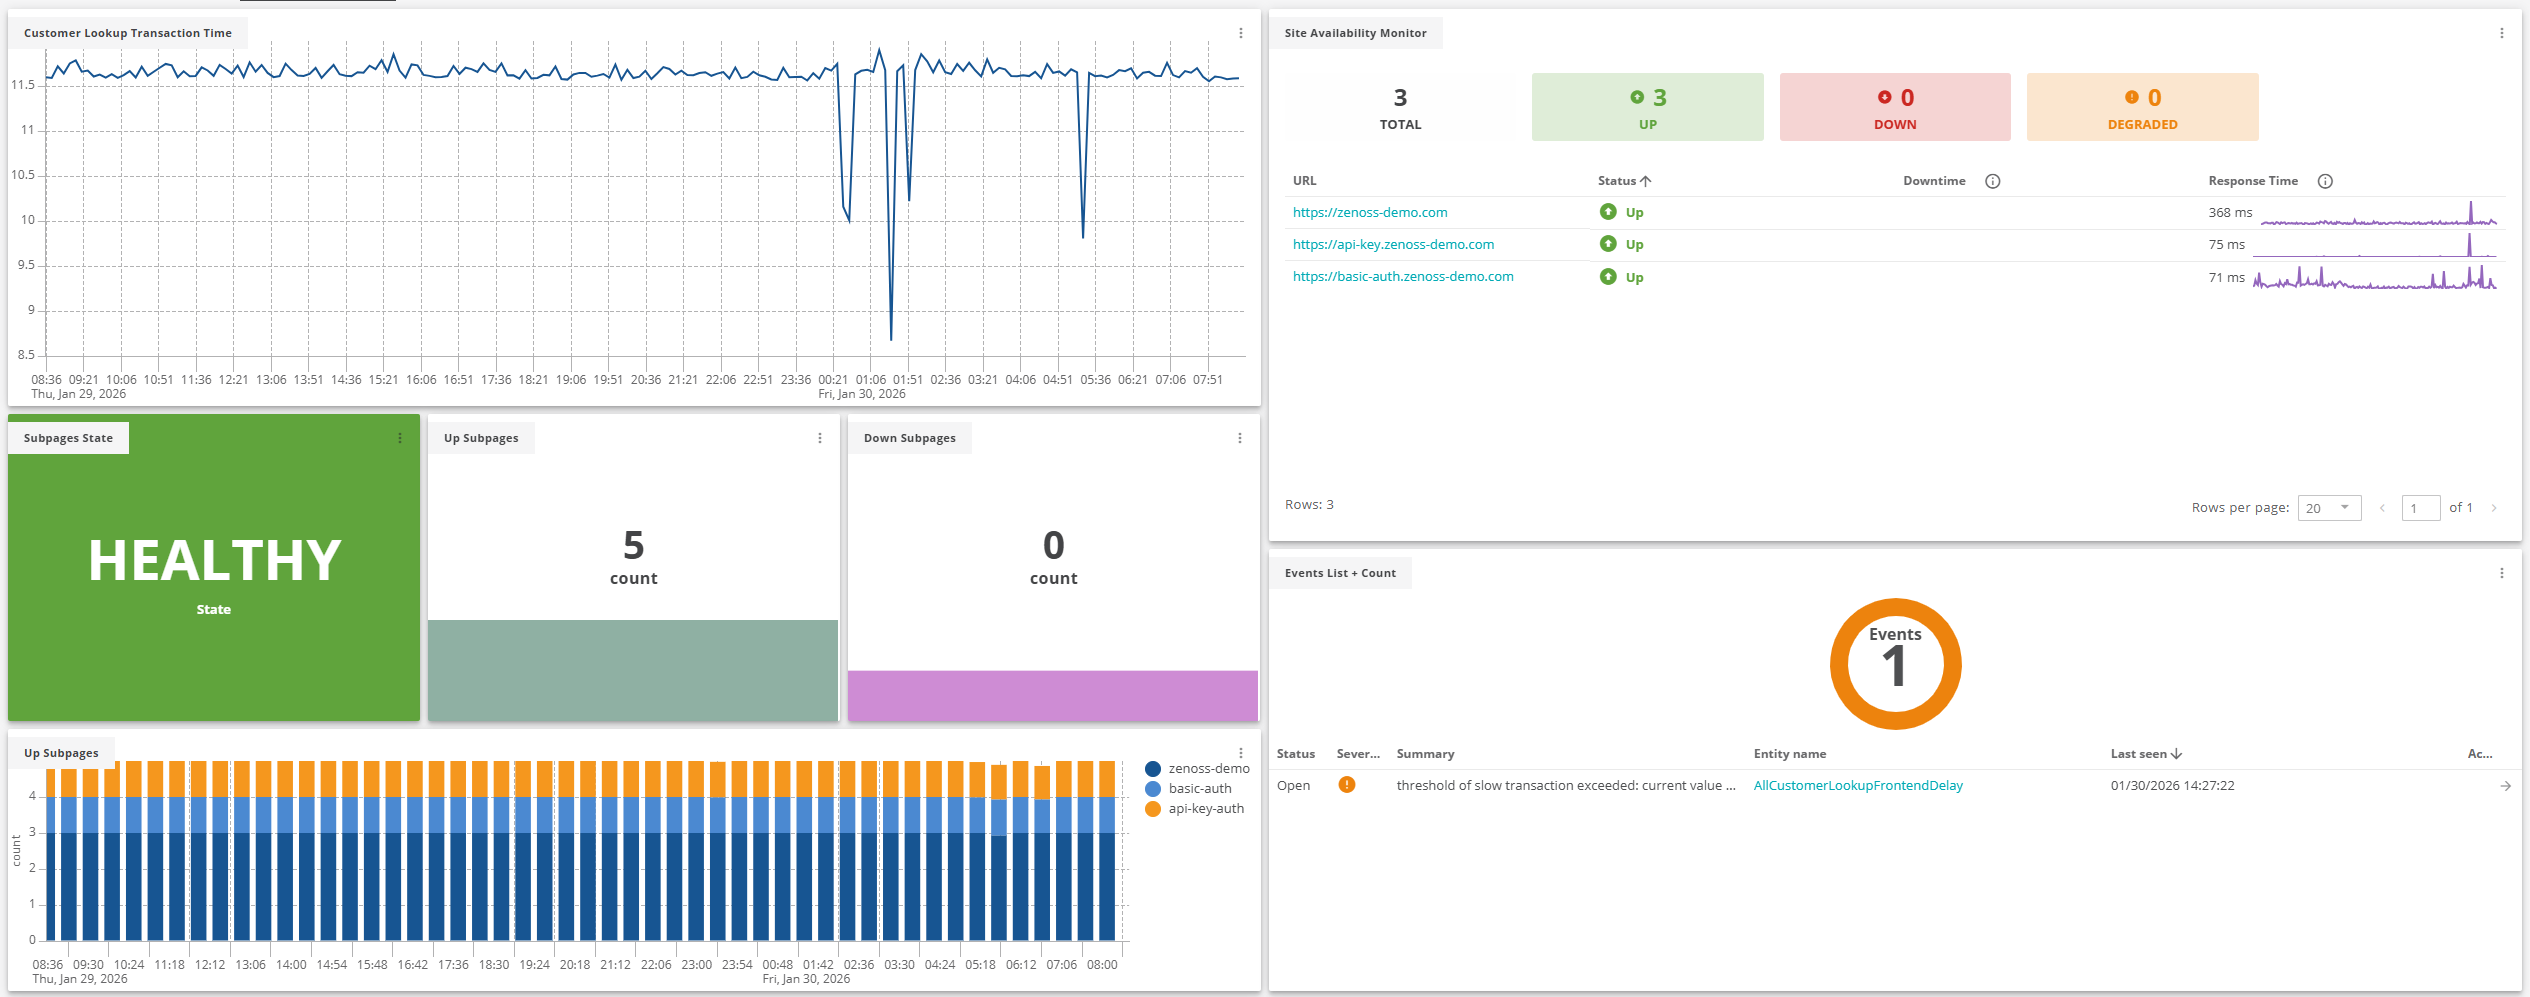
Synthetic Monitoring Tools
Synthetic and Availability Observability
- Continuously test user paths to detect degradation early.
- Separate true downtime from localized failures across DNS, network paths, and shared services.
- Track availability against business SLAs with clear evidence.
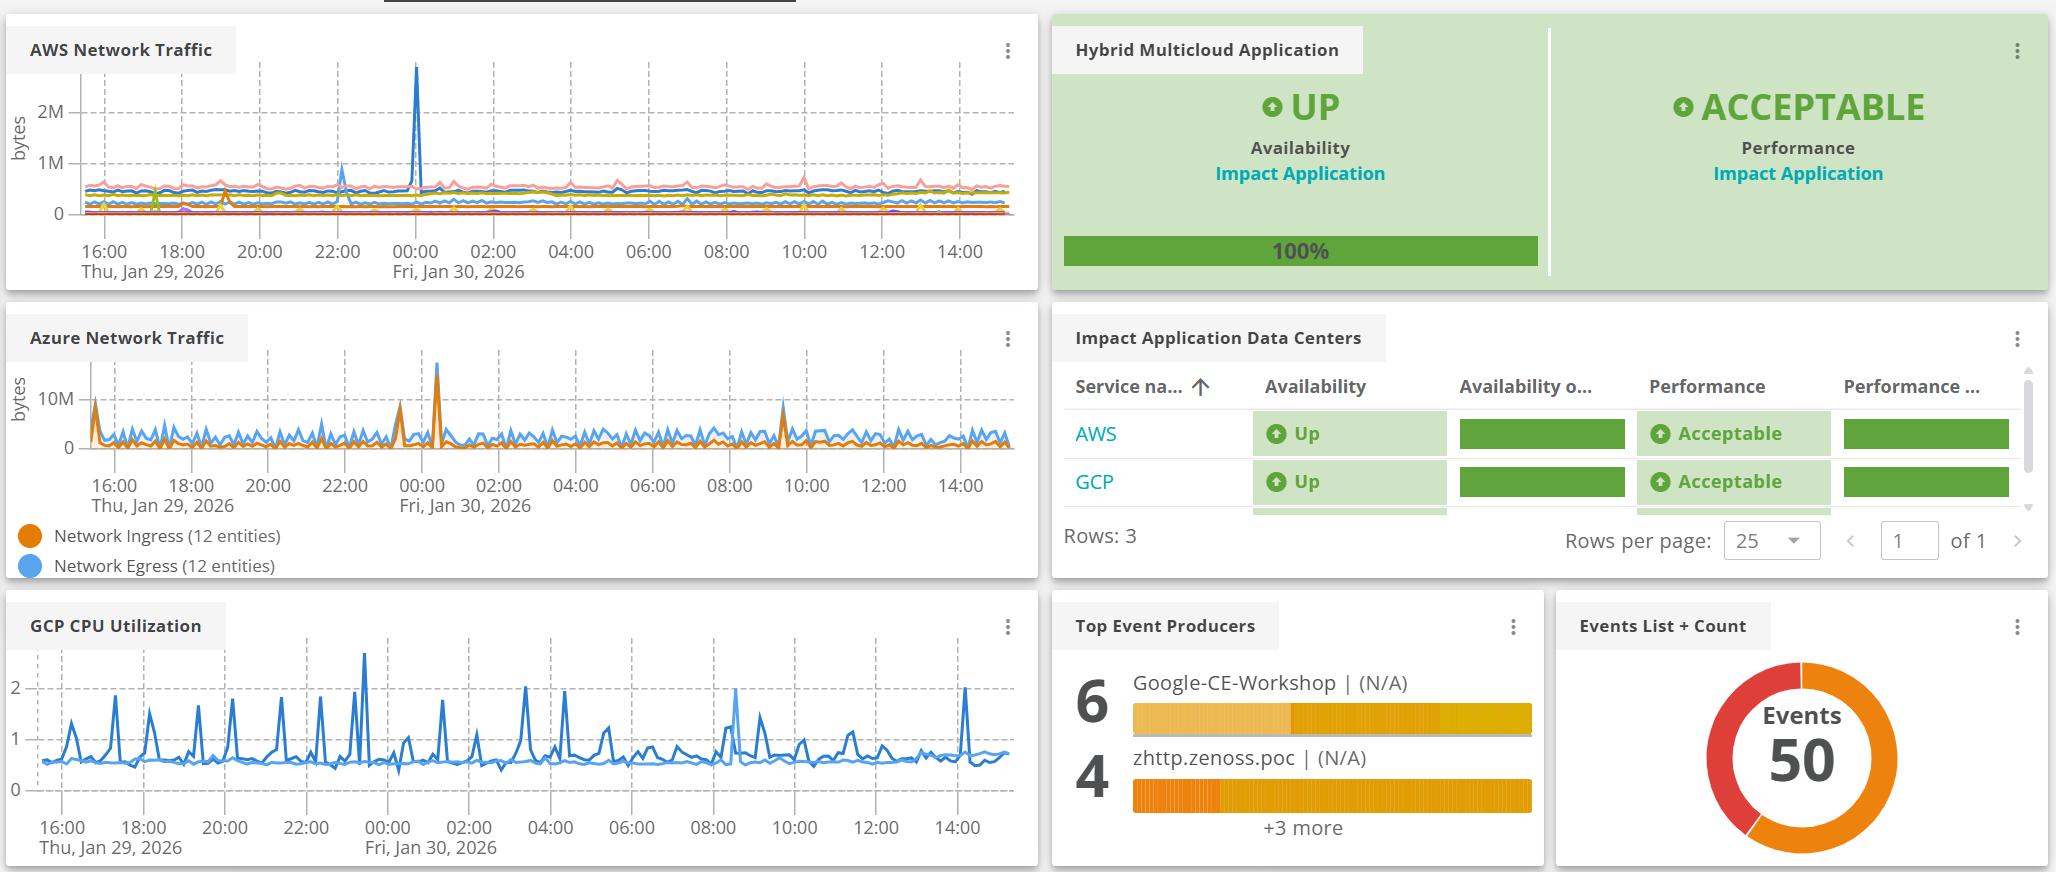
Hybrid Infrastructure Observability
System-Aware Observability
- Cloud: Follow dynamic services and dependencies across multi-cloud environments.
- On-premises: Deep visibility from bare metal through virtualization and platforms with full compute observability.
- Hybrid: Correlate signals across distributed infrastructure without visibility gaps.
- Air-gapped: Built for secure, disconnected environments, including federal and mission-critical deployments.