AO
Application Observability
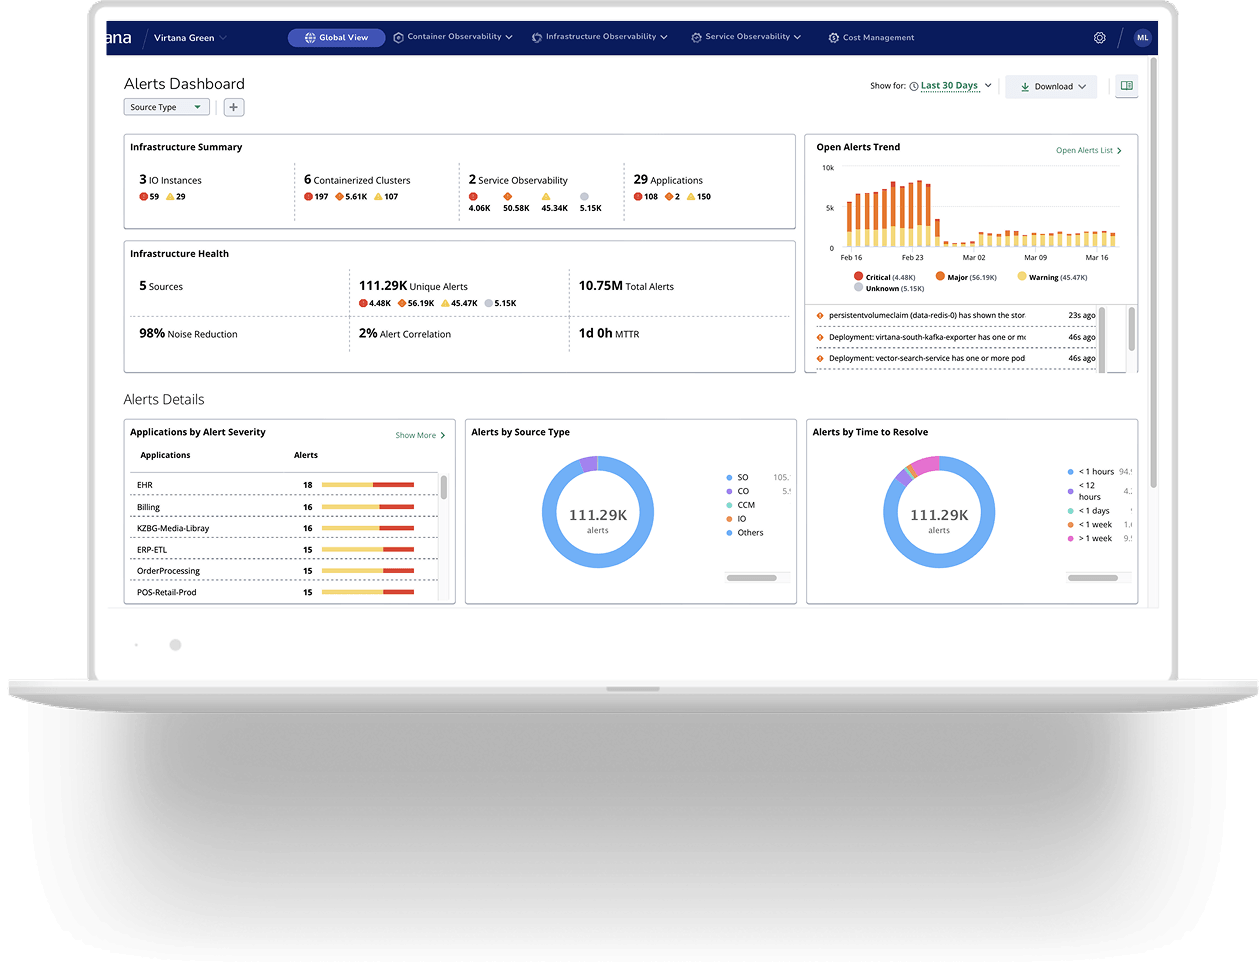
Trace transactions across services, Kubernetes, infrastructure, storage, and networks to find the dependency affecting users.


DevOps monitoring should show how each deployment affects the systems connected to your services. Fragmented CI/CD, application, and infrastructure tools can hide critical dependencies.
Virtana connects fragmented operational data through system-aware observability across applications, services, Kubernetes, infrastructure, networks, storage, cloud resources, data pipelines, and AI workloads.
Connect each change to service impact, find root cause faster, and ship with less risk.
— Kyle Kopp, Infrastructure Manager, Huntington Bank.
Huntington Bank reduced MTTR by 85% and used cost savings to fund 65% headcount growth.
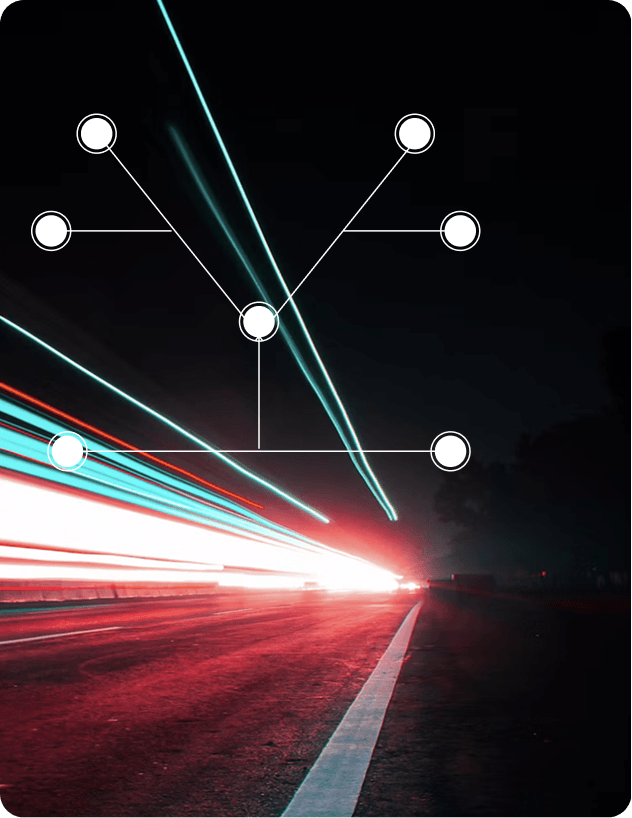
Virtana correlates deployment events and configuration changes with application behavior and live dependencies.
Teams can trace how a Kubernetes update affects storage latency, service response time, and customer-facing performance.
Bring deployment, application, and infrastructure context into a shared system view. See which services depend on the affected components and evaluate the impact of each change.

A single release issue can trigger alarms across pods, hosts, networks, storage, services, and applications. Stacked alerts still leave teams comparing dashboards during a war room in order to find the root cause.
The System Dependency Graph shows how impact moves across connected components, both upstream and downstream.
Virtana combines the System Dependency Graph, Event Intelligence, and Diagnostic AI Agents to distinguish symptoms from constraints and identify evidence-backed root cause across operational layers.
Diagnostic AI Agents evaluate dependencies and supporting evidence across operational layers. DevOps, SRE, and infrastructure teams can agree on where to act and reduce MTTR.
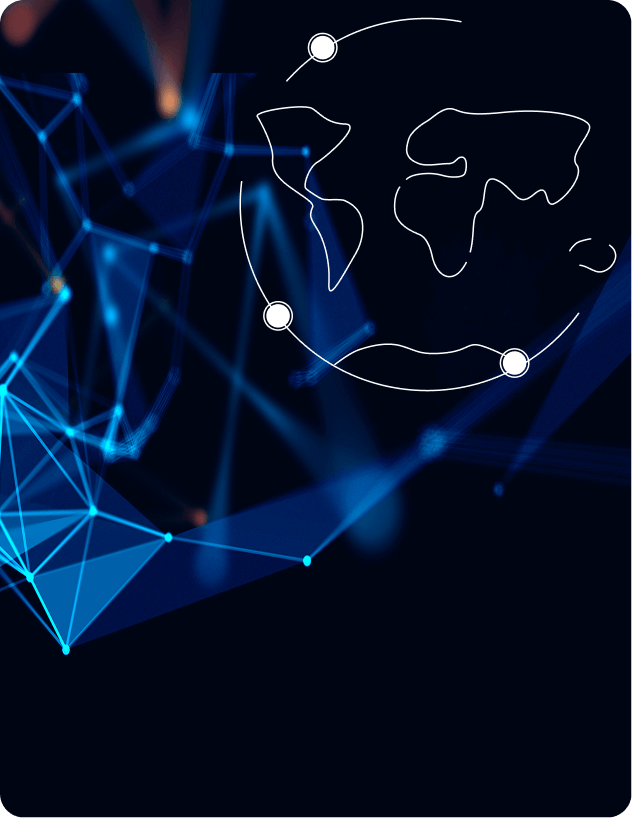
The System Dependency Graph continuously maps relationships across applications, services, Kubernetes, infrastructure, networks, storage, cloud resources, data pipelines, and AI workloads.
As workloads move or services change, Virtana’s operational context changes with it. Application, platform, and infrastructure teams work from the same dependency context.

After release, Virtana detects emerging contention, saturation, and abnormal behavior before they affect services or threaten SLAs. Service impact helps teams prioritize the right response.
Automation and orchestration can trigger governed actions based on policies, ownership, and operational risk. Faster validation and controlled response can reduce change failures and recovery time.

Open integrations bring system context into existing incident and operational workflows. Teams gain more automation while retaining approval controls for higher-risk actions.
Choose SaaS, self-hosted, or on-premises deployment to match security, governance, and operational requirements. Customer-controlled options also support sovereign and air-gapped environments when needed.
Virtana links release activity to the system that supports each service. Every capability shares a common data model, topology, System Dependency Graph, Event Intelligence, and automation framework.
Trace transactions across services, Kubernetes, infrastructure, storage, and networks to find the dependency affecting users.
Use operational context, diagnostic agents, natural-language analysis, and governed action to move from signal to resolution faster.
See how one operational model connects application, service, infrastructure, and AI Factory Observability.
Virtana supports the environments enterprise teams depend on most.

DevOps monitoring is the continuous tracking of application, service, infrastructure, and delivery-pipeline health throughout the software development lifecycle. It helps DevOps and SRE teams understand how deployments and configuration changes affect the performance, availability, and reliability of production services.
Virtana provides DevOps monitoring through system-aware observability, connecting application and deployment activity to live dependencies across Kubernetes, infrastructure, networks, storage, cloud, data pipelines, and AI workloads. This shared system context helps teams identify evidence-backed root cause and understand service impact without manually correlating disconnected monitoring tools.
Monitoring tracks known signals and conditions. DevOps observability explains system behavior by connecting telemetry with topology, dependencies, events, and operational context.
Virtana adds cross-layer correlation and agentic AI-powered root cause analysis, helping teams understand where an issue began and which services face downstream impact.
Dependency context helps teams identify the constraint driving an incident without comparing disconnected dashboards. Governed automation can then accelerate investigation and response. Earlier feedback can also reduce late-stage rework and delays between release stages.
Enterprise DevOps monitoring tools should include:
Together, these capabilities extend pipeline monitoring into the applications, services, and infrastructure affected by each release.
Virtana connects deployment and configuration changes to live dependencies, service behavior, and infrastructure conditions. Teams can assess impact before rollout and validate performance after release. System evidence can also inform incident workflows and approved automated responses.