

GPU Monitoring Software
Turn GPU Insights Into Better AI Performance
Idle GPUs, resource contention, and rising power costs can drain AI budgets while teams search disconnected tools for answers.
Virtana brings GPU monitoring into a system-aware view of the complete AI factory. You can:
- Connect GPU utilization, health, power, and cost to workloads, applications, infrastructure, data movement, token consumption, training, and inference.
- Identify whether slow performance originates in the GPU, storage, networks, Kubernetes, orchestration, or another dependency.
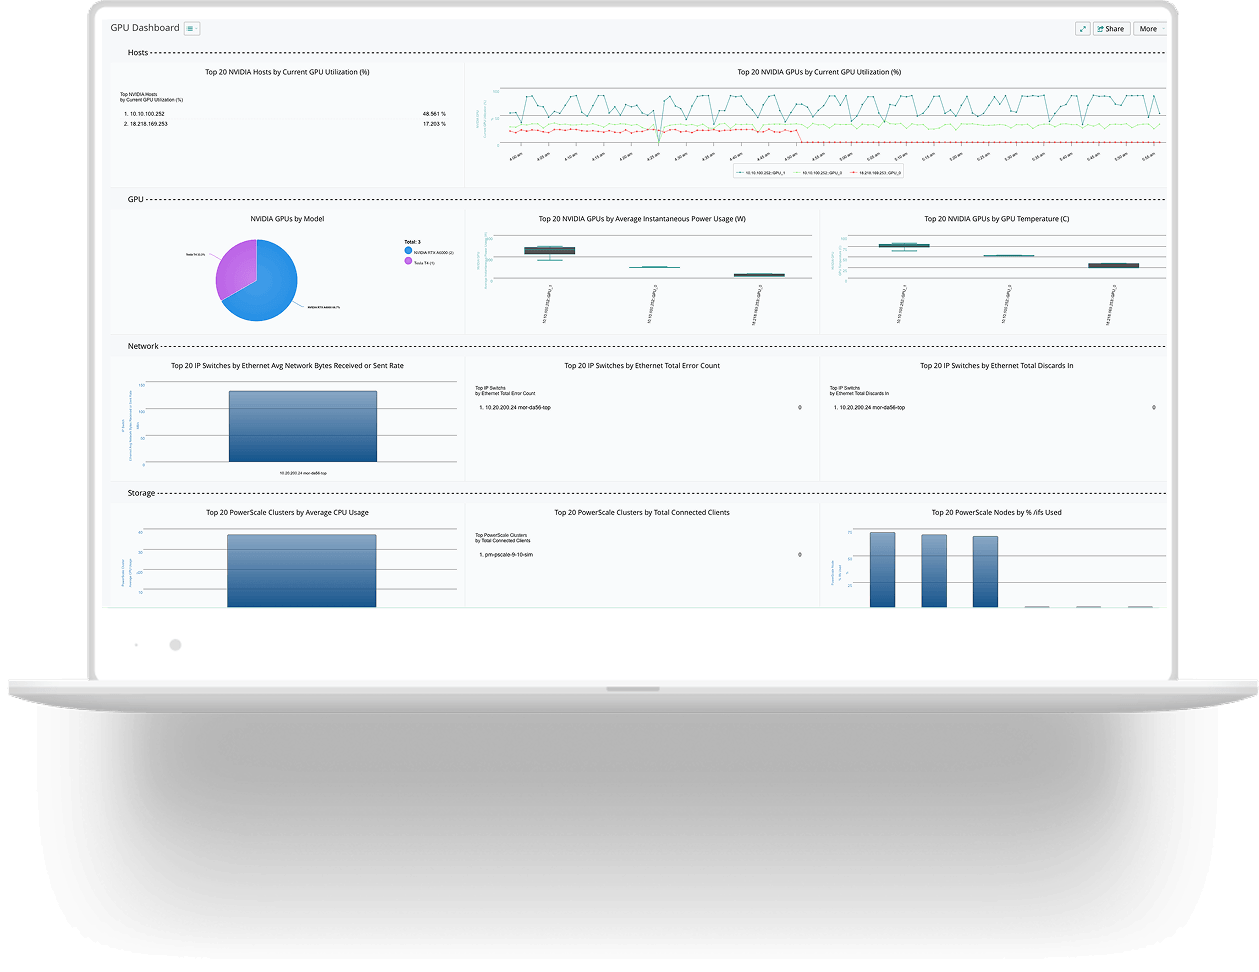
“Virtana Made It Easy to Pinpoint What Was Happening in Our Environment.”
— Principal Data Architect, Leading U.S. Cancer Hospital
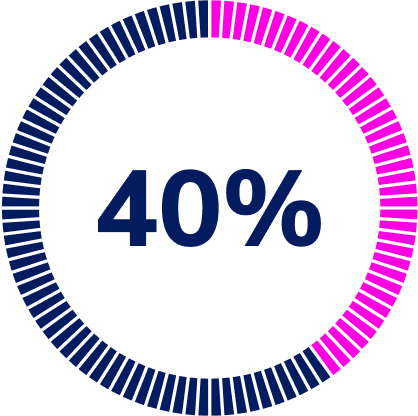
40% Reduction in Idle GPU Time
Real-time visibility and optimization lowered GPU underutilization across environments.
Global FSI Customer
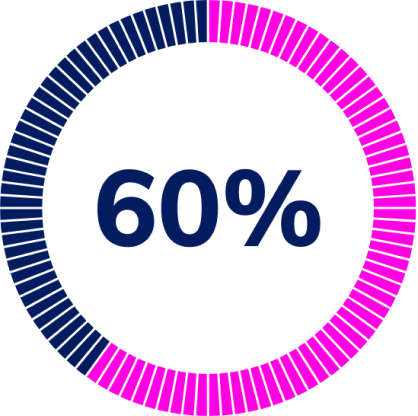
60% Faster Root-Cause Diagnosis
Cross-stack analysis traced AI performance issues to infrastructure bottlenecks.
Healthcare Provider
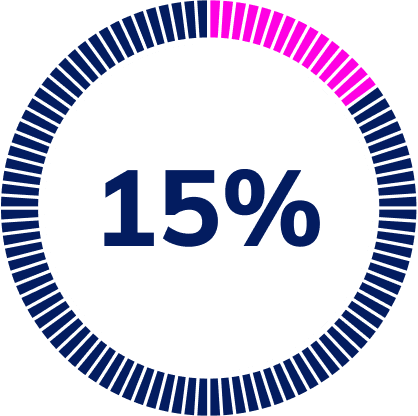
15% Lower Power Usage
Energy analytics surfaced throttled GPUs for targeted optimization.
AI Lab – USA
Go Beyond GPU Monitoring with System-Wide Observability
GPU monitoring tells you what’s happening at the device. Virtana goes further, connecting GPU signals to the workloads, applications, infrastructure, and dependencies that determine AI performance.
When utilization drops or performance changes, teams can see beyond the GPU to understand why it happened, what it impacts, and where to act. This system-aware approach connects GPU monitoring to the broader observability needed to operate the complete AI factory.

AI Factory Observability
Connect GPU performance to AI workloads, model pipelines, data movement, power, cost, training, and inference.

Infrastructure Observability
Understand the compute, storage, network, Kubernetes, and hybrid infrastructure dependencies supporting GPU workloads.

Virtana Agentic Observability Platform
Connect GPU and AI Factory insights to system-wide context, AI-driven root cause analysis, and governed action.
Real-Time GPU Utilization and Cost Insights
Track utilization across GPUs, nodes, hosts, and clusters. Identify idle devices, underused memory, reserved capacity without active workloads, and uneven demand across training jobs, inference services, teams, and environments.
Virtana connects GPU activity and power consumption to workload cost and token economics.
Teams can see where expensive resources support useful work, where capacity sits idle, and where supporting infrastructure limits performance. These insights help reduce waste across on-premises clusters and cloud GPU environments, and provide visibility into how models are performing
Explore how AI Factory Observability connects infrastructure performance to AI service cost.
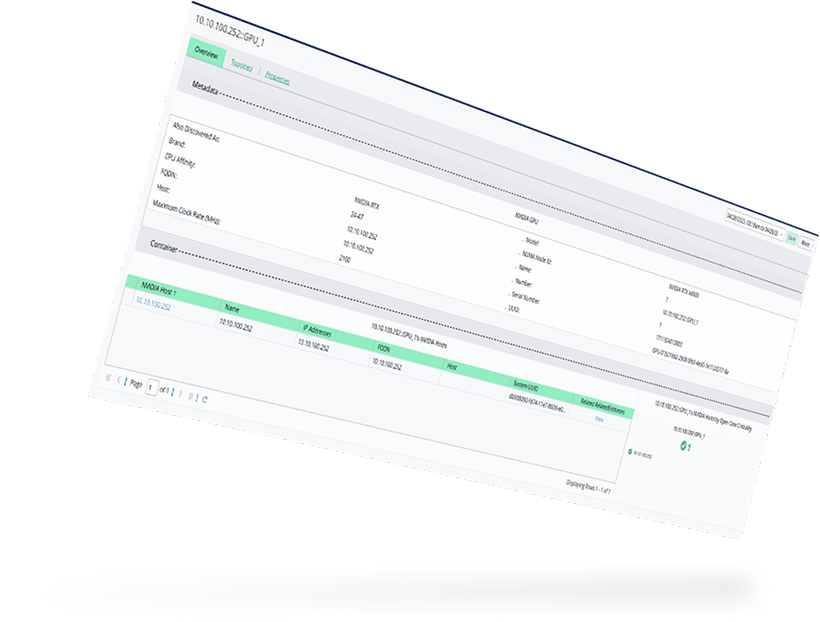
Detect GPU Bottlenecks Before They Affect SLAs
Thermal throttling, memory pressure, clock-speed changes, and hardware errors can slow a workload before a device goes offline. Virtana monitors GPU health and performance signals in real time.
Early warning signals help teams identify degradation, resource contention, and unstable behavior before these issues spread across a cluster or affect a production AI workload. Teams can isolate the affected GPU, host, or workload and investigate the dependencies contributing to the issue.
Earlier intervention helps protect training schedules, inference latency targets, and the applications that depend on AI output.
Consistent GPU Health Across Hybrid Environments
Collect consistent health and performance telemetry across HPE, Dell and Nutanix AI Factories. Monitor temperature, memory, clock speeds, power, and hardware errors in a single operational view. Track hardware-specific accelerator activity, including NVIDIA Tensor Core signals where available.
The same observability model can span on-premises data centers, private cloud, public cloud, and hybrid environments. Teams can compare resources, identify uneven utilization, confirm available capacity, and make better placement decisions across the GPU estate.

Full-Stack Correlation From GPU to Application
A GPU metric can show where performance changed. It may not explain what caused the change or which AI service was impacted.
Virtana’s System Dependency Graph connects GPU behavior to hosts, Kubernetes services, storage, network paths, data pipelines, model workloads, and application traces. This system context helps teams follow cause-and-effect across the AI execution environment.
For example, low GPU utilization may originate in storage latency or data-fabric congestion. Virtana shows how the constraint affects model throughput, inference latency, and the performance of dependent applications.

Optimize Job Placement and GPU Contention
See how training and inference workloads consume resources across GPUs, nodes, and hosts.
Placement context can reveal overlapping demand, noisy neighbors, overreserved capacity, and workloads affected by degraded infrastructure or congested data paths.
Teams can move work away from constrained resources and distribute workloads across available capacity.
Better placement can improve throughput, reduce queue time, and help teams use existing infrastructure before adding capacity.
Agentic AI for AI Factory Operations
Built for Complex Enterprise Environments
Virtana’s diagnostic and remediation agents use live dependencies, events, and operational evidence across the AI factory. They identify the constraint behind an issue, show the affected components, and support governed action.
- Diagnostic AI Agents: Trace symptoms across GPUs, networks, storage, Kubernetes, models, and applications to establish evidence-backed root cause.
- Remediation AI Agents: Recommend or automate approved corrective actions using system context and defined policies.
- Natural-Language Operations: Let teams investigate conditions and dependencies using plain-language questions.
- MCP Server: Extend structured system context to connected enterprise AI assistants and automation tools.

Why Virtana for Enterprise Network Monitoring
Virtana treats GPUs as part of a connected AI execution system rather than as isolated devices. Virtana connects GPU health and utilization to:
- Training and inference workloads
- Storage and data movement
- Networks and Kubernetes
- Model and application performance
- Power, capacity, cost, and token consumption
- Downstream service impact
Every capability operates on the same system-aware foundation, including a common operational model, continuous discovery, the System Dependency Graph, Event Intelligence, and agentic AI for automating diagnosis and remediation.
Virtana follows an Observe, Reason, Act operating model:
- Observe: Virtana builds a current view of GPU health, workloads, dependencies, power, capacity, cost, and token use: not just within the AI Factory, but across the entire system.
- Reason: Trace cause and effect to identify the operational constraint and affected services to accurately narrow down root cause
- Act: Recommend or automate corrective steps under defined policies
Virtana supports hybrid and customer-controlled environments, helping teams maintain operational context across cloud and on-premises AI infrastructure.
Explore More Resources
- AI Factory Observability: Connect GPU performance, memory, power, data movement, token costs, training, and inference across your AI environment.
- Beyond GPU Metrics eBook: See why GPU utilization alone cannot explain AI performance, reliability, costs, or returns.
- Agentic AI: Investigate dependencies, identify root causes, and support governed actions across applications, infrastructure, services, and AI workloads.
Trusted by Enterprise Teams

GPU Monitoring FAQs
GPU monitoring software tracks utilization, memory, temperature, power, clock speeds, errors, health, and cost across GPU infrastructure. It helps teams identify idle capacity, degraded devices, and resource contention.
For AI workloads, GPU monitoring is more useful when it also connects device behavior to hosts, Kubernetes, networks, storage, applications, model pipelines, token consumption, training, and inference.
GPU monitoring shows what is happening through metrics, thresholds, and alerts. GPU observability explains why the behavior changed and how it affects the wider AI system.
Virtana maps GPU signals to live dependencies through the System Dependency Graph. Diagnostic agents trace the cause-and-effect from an infrastructure constraint to impacts on training, inference, and application.
GPU metrics can reveal low utilization, high temperature, memory pressure, or hardware errors. They may not identify the condition producing those signals.
Storage latency can delay input, leaving GPUs waiting. Network congestion can limit data movement. Poor workload placement can create contention. System context connects those symptoms to the initiating constraint and resulting service or cost impact.
GPU observability identifies idle resources, unused reservations, throttling, and inefficient workload placement. Teams can reclaim capacity, move workloads, or address supporting infrastructure before purchasing more GPUs.
Virtana also connects utilization to power, workload demand, and token economics. A global financial services customer reduced idle GPU time by 40%, while a U.S. AI lab lowered power usage by 15% after identifying throttled GPUs.
Yes. Virtana collects vendor-agnostic telemetry across NVIDIA, AMD, and other GPU platforms. Teams can monitor health, utilization, temperature, memory, power, clock speeds, and hardware-specific accelerator activity.
The same view spans on-premises and cloud GPU instances. It helps teams compare mixed infrastructure, locate constraints, and make consistent capacity and placement decisions across hybrid environments.