AIOps
Monitoring GPUs Won’t Protect Your AI ROI
See how token demand, GPU use, capacity, and infrastructure cost shape AI returns



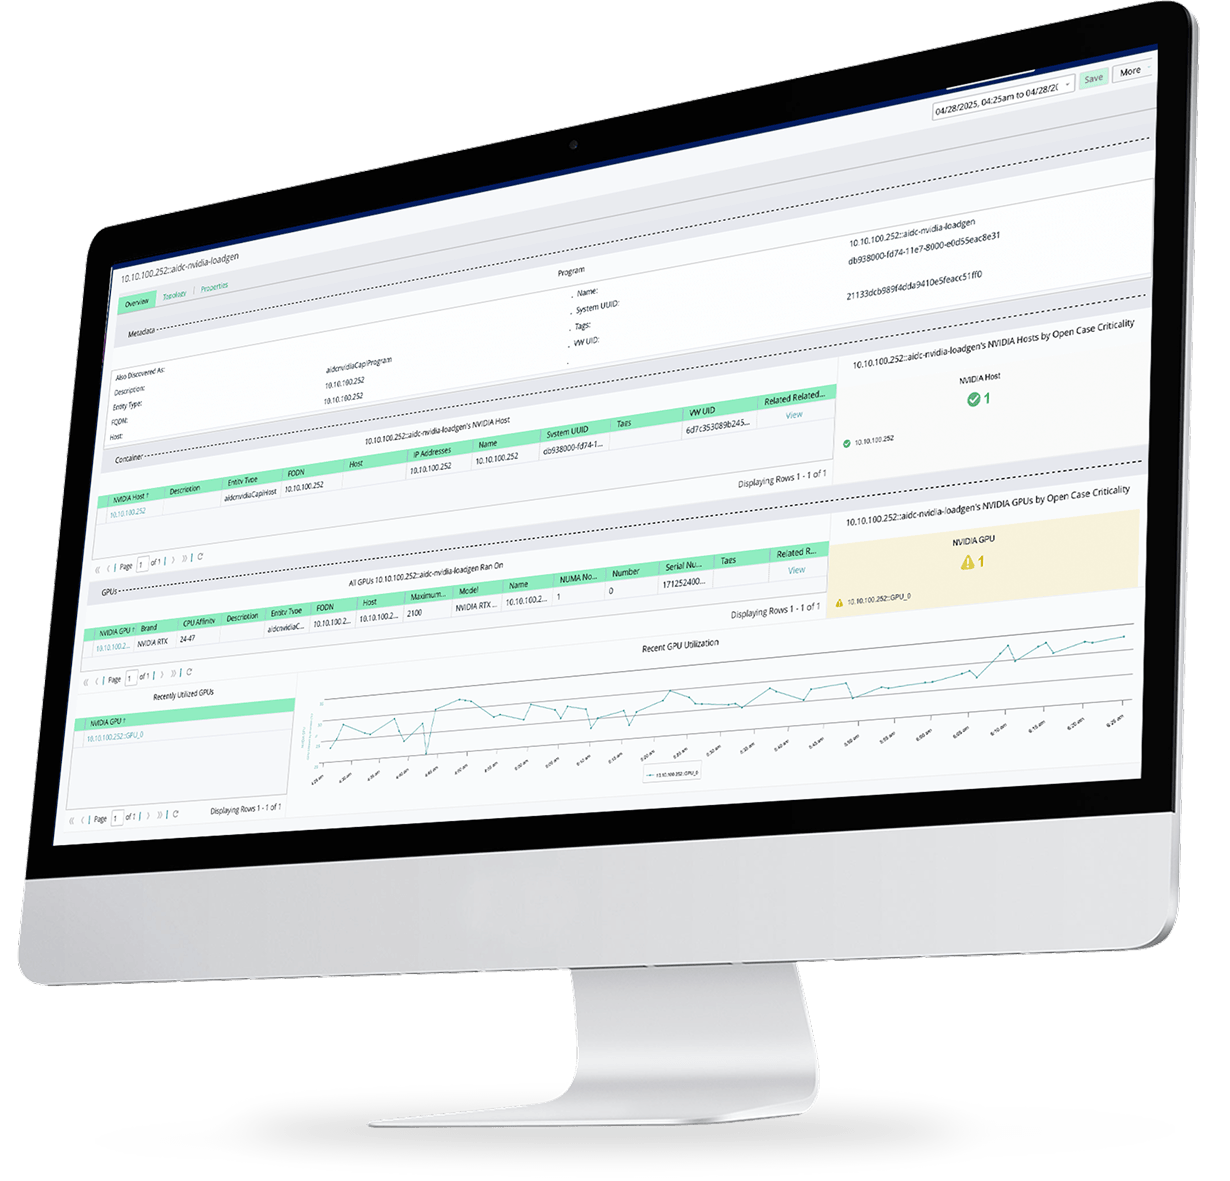
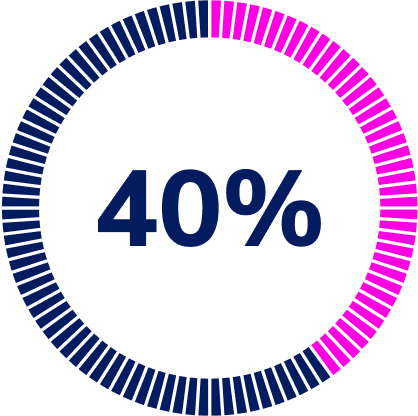
Real-time visibility and optimization lowered GPU underutilization across environments.
Global FSI Customer
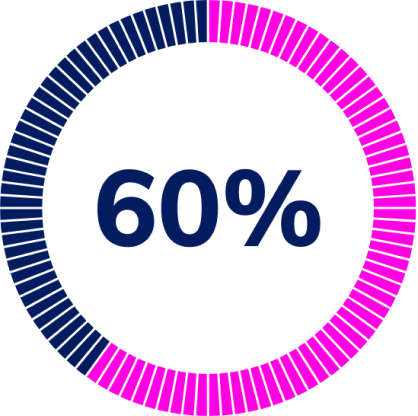
Cross-stack analysis traced AI performance issues to infrastructure bottlenecks.
Healthcare Provider
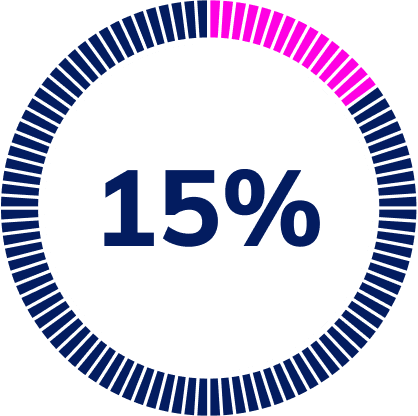
Energy analytics surfaced throttled GPUs for targeted optimization.
AI Lab – USA
See where AI agents and inference services run across Kubernetes clusters, cloud resources, and on-premises infrastructure. Follow each request through the services, pods, nodes, and compute resources involved.
Virtana’s agent monitoring software keeps AI agent workload placement and runtime dependencies up to date as services move and clusters scale.
Teams can replace fragmented per-framework dashboards and investigate AI agent performance and failures with the relevant runtime context already available.
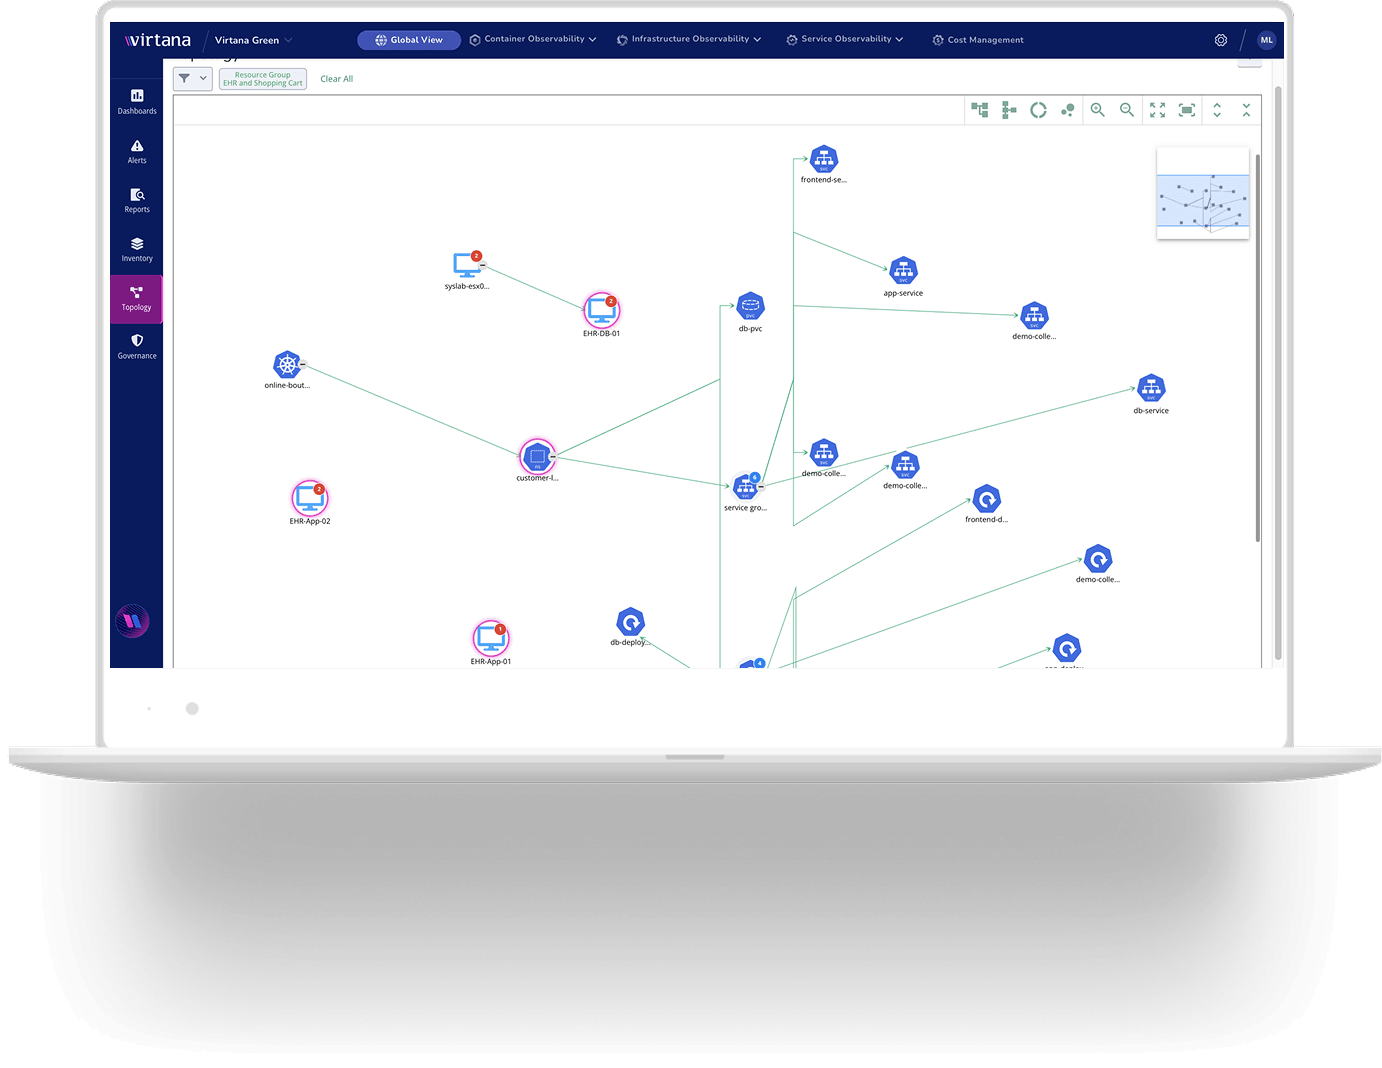
Virtana observes AI agents and the GPUs, networks, storage, applications, and hybrid infrastructure that support them within a single system-aware platform.
Many point tools focus on one segment of the production execution path. Virtana connects agent and inference activity with the operational dependencies behind each interaction.
The System Dependency Graph maintains a current map of applications, services, Kubernetes, compute, networks, storage, and cloud resources. When performance changes, teams can follow the dependency path from the affected service to the likely constrained resource.

Connects GPU behavior, AI workloads, model pipelines, and token economics

Covers hybrid and multi-cloud resources supporting production AI

Uses diagnostic and remediation AI agents to investigate operational issues and support governed action
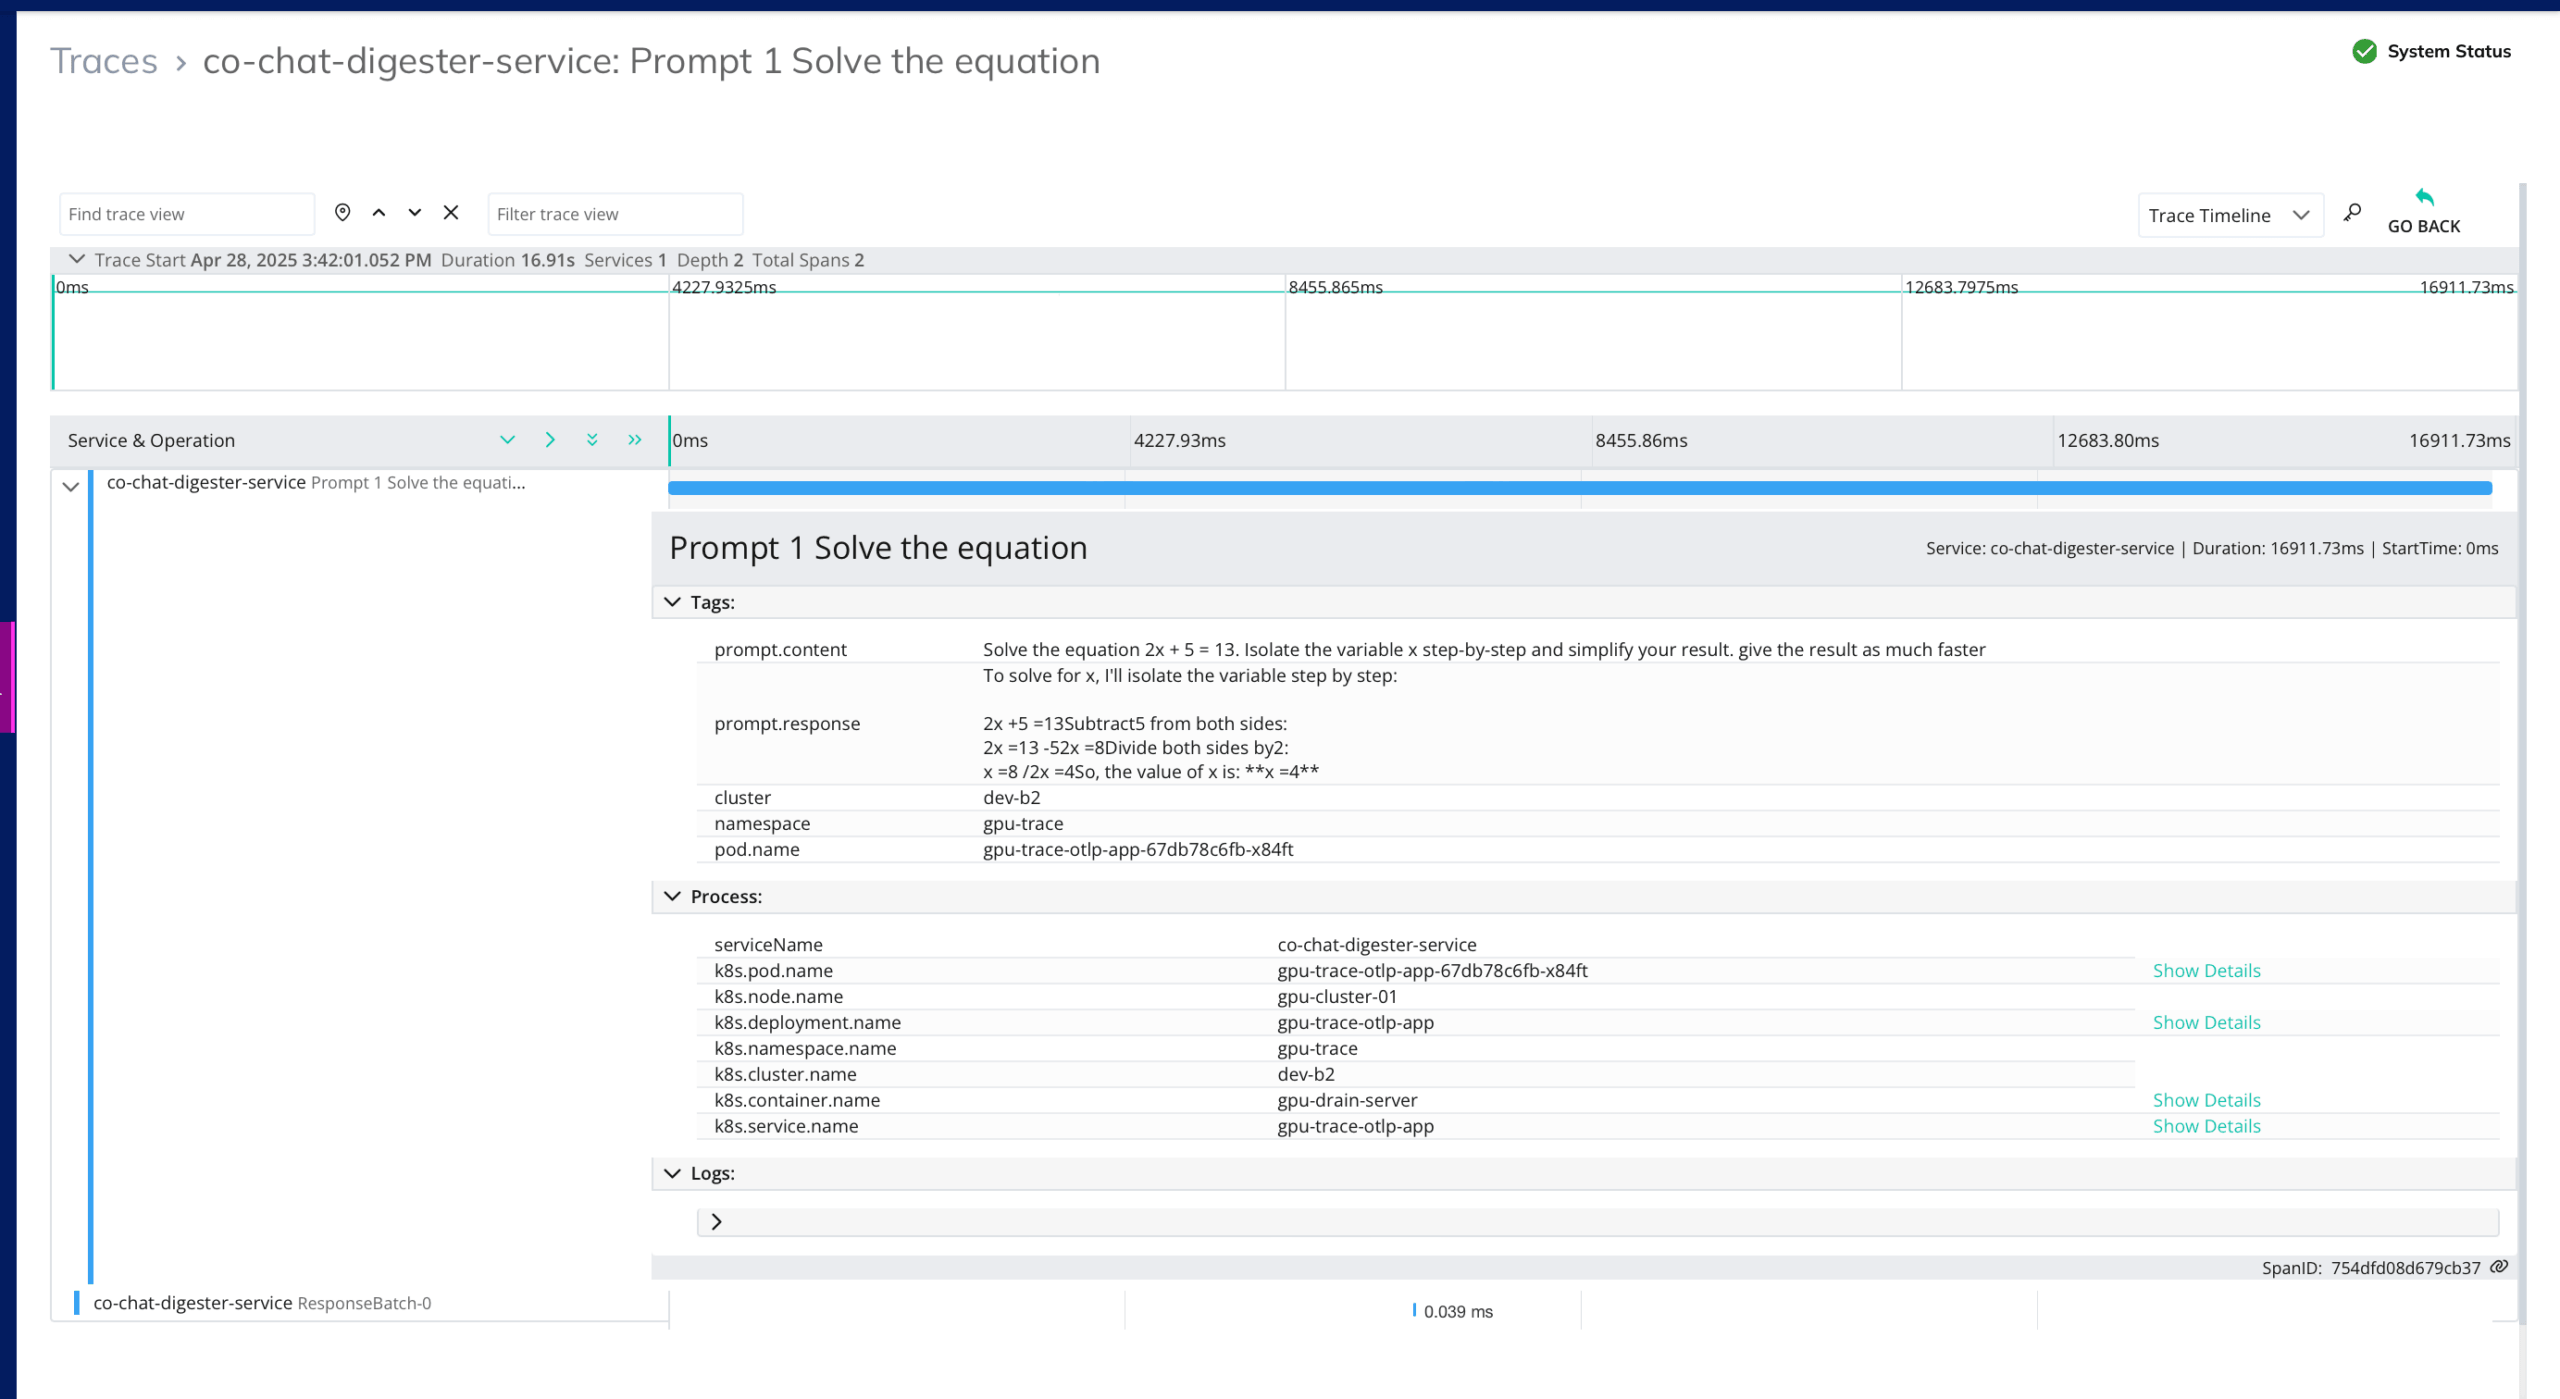
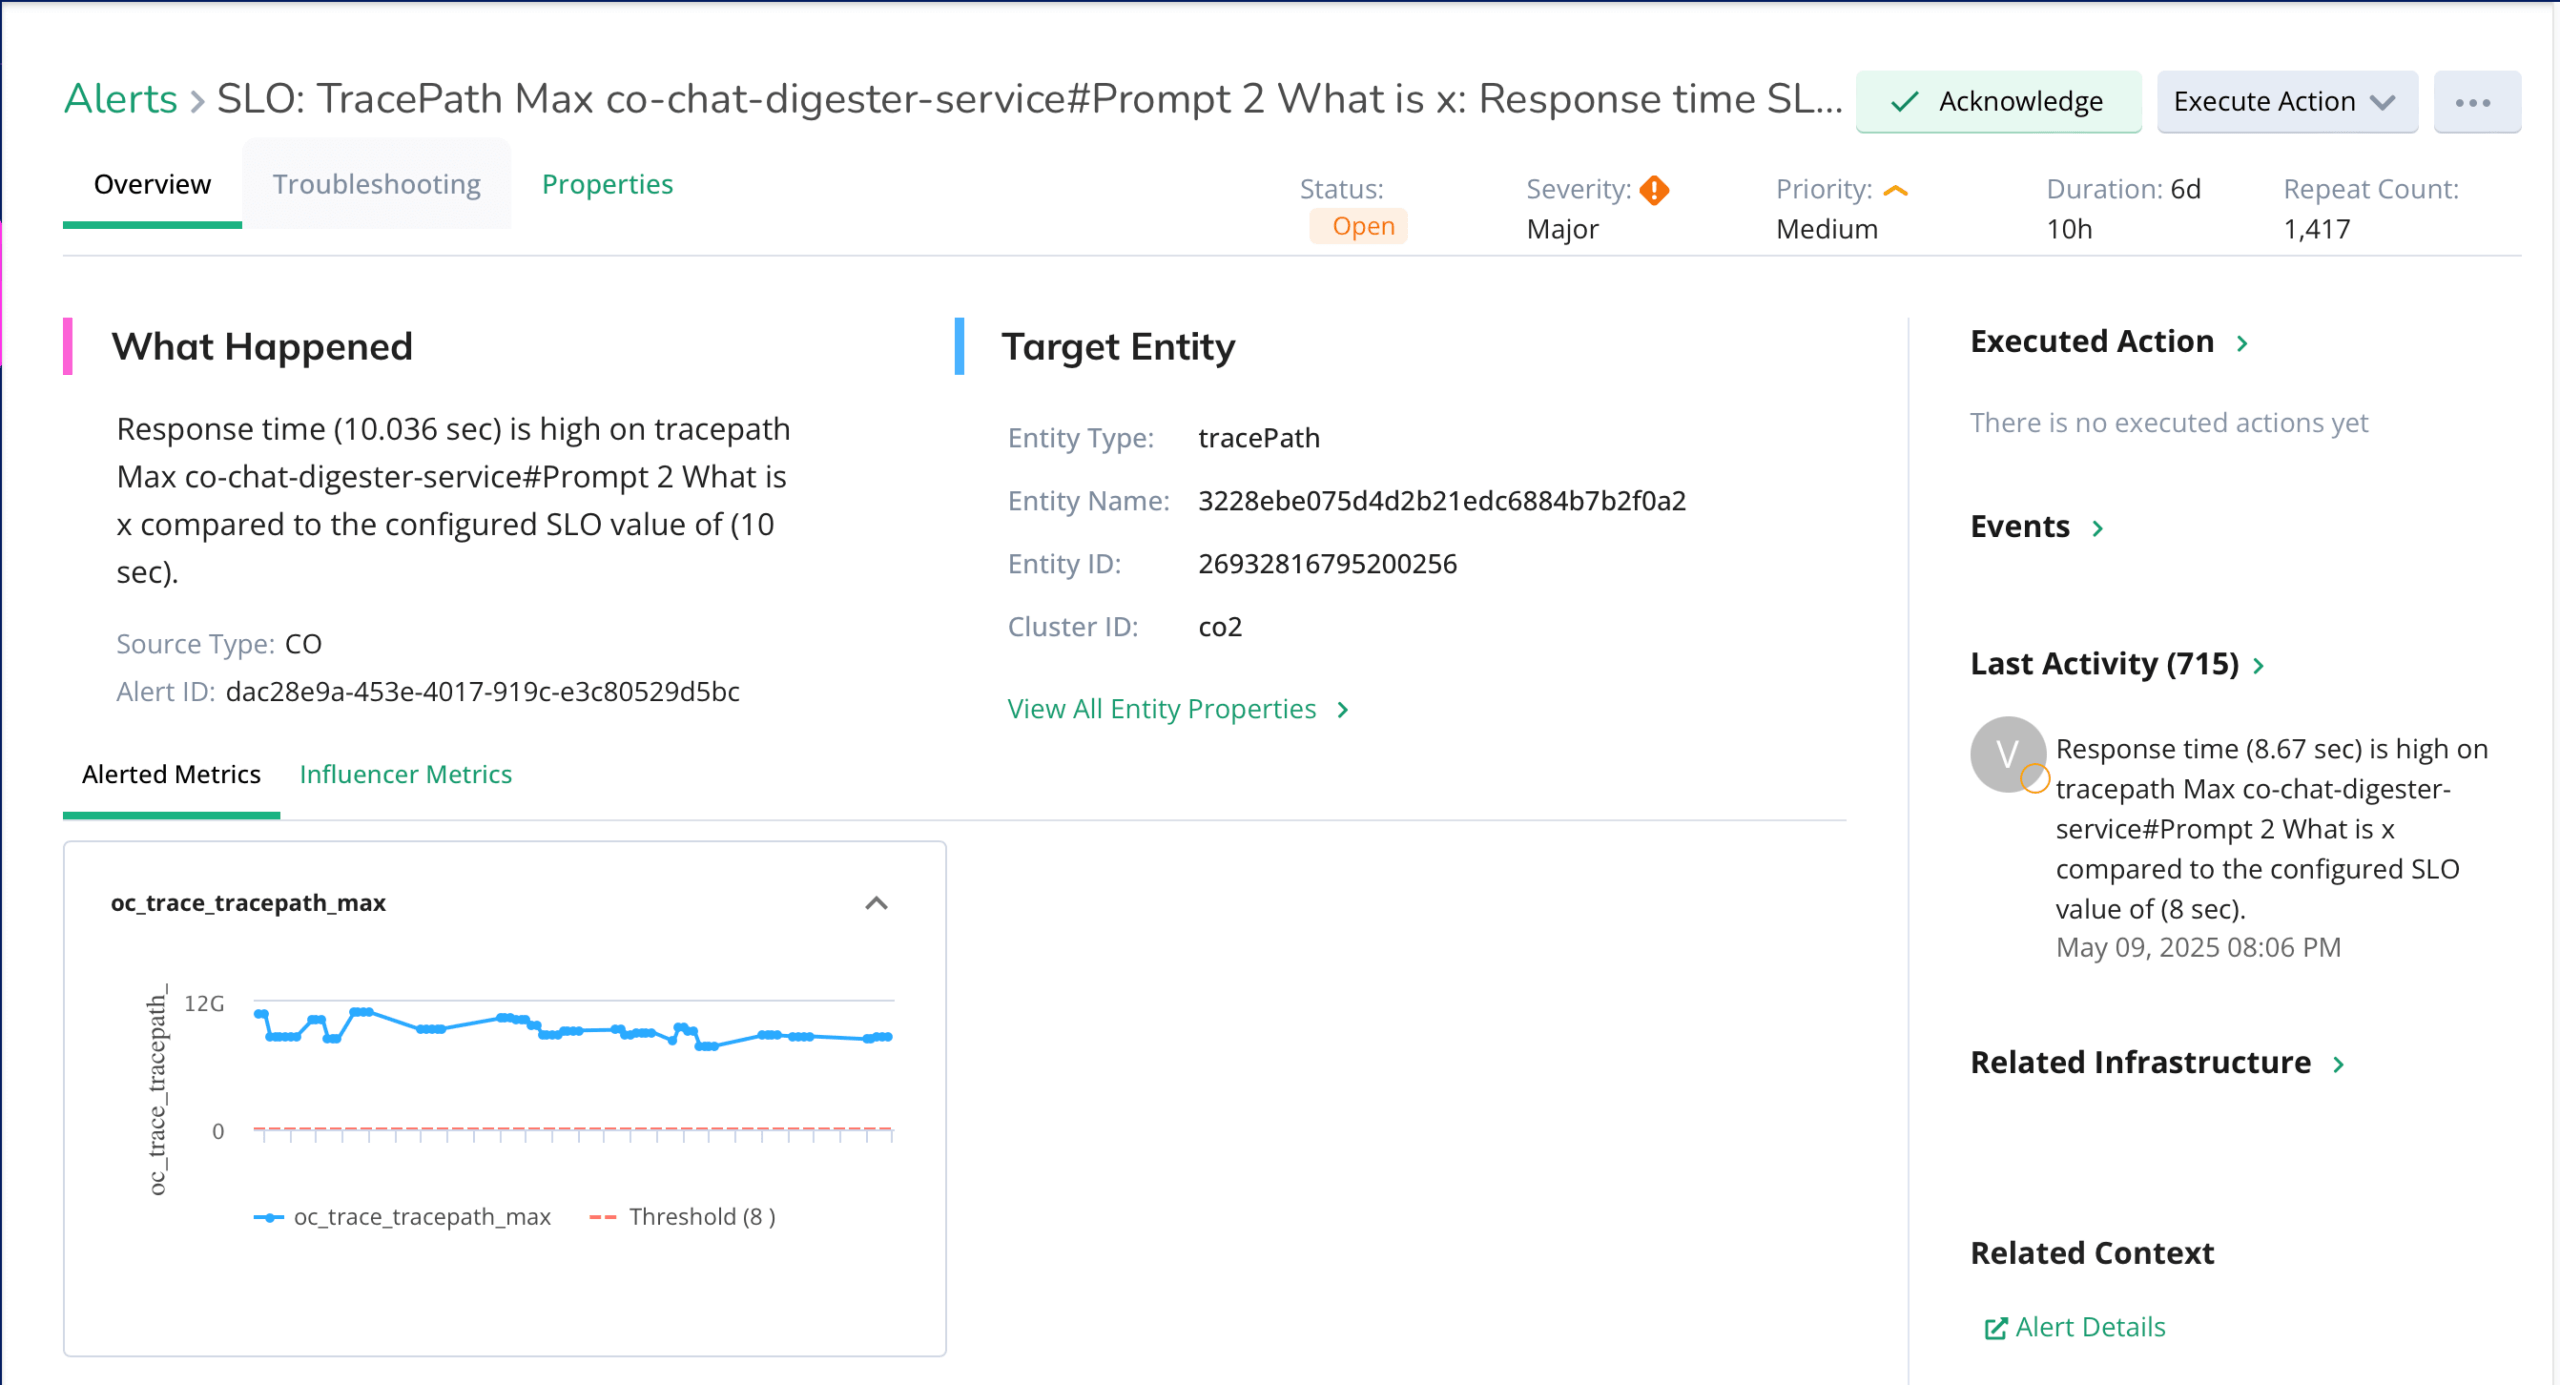
Use OpenTelemetry tracing to follow AI agent requests and interactions through applications, services, pods, and infrastructure.
Correlate a slow or failed agent interaction with the node, GPU, network path, or storage backend supporting it. This connected trace helps teams determine whether latency began within the agent workflow, a supporting service, or deeper in the infrastructure.
Application and infrastructure teams can inspect the same agent execution path, reducing manual correlation and unnecessary handoffs during an incident.
Explore Application ObersvabilityTrack response times, throughput, and resource usage across LLMs, chatbots, and inference services.
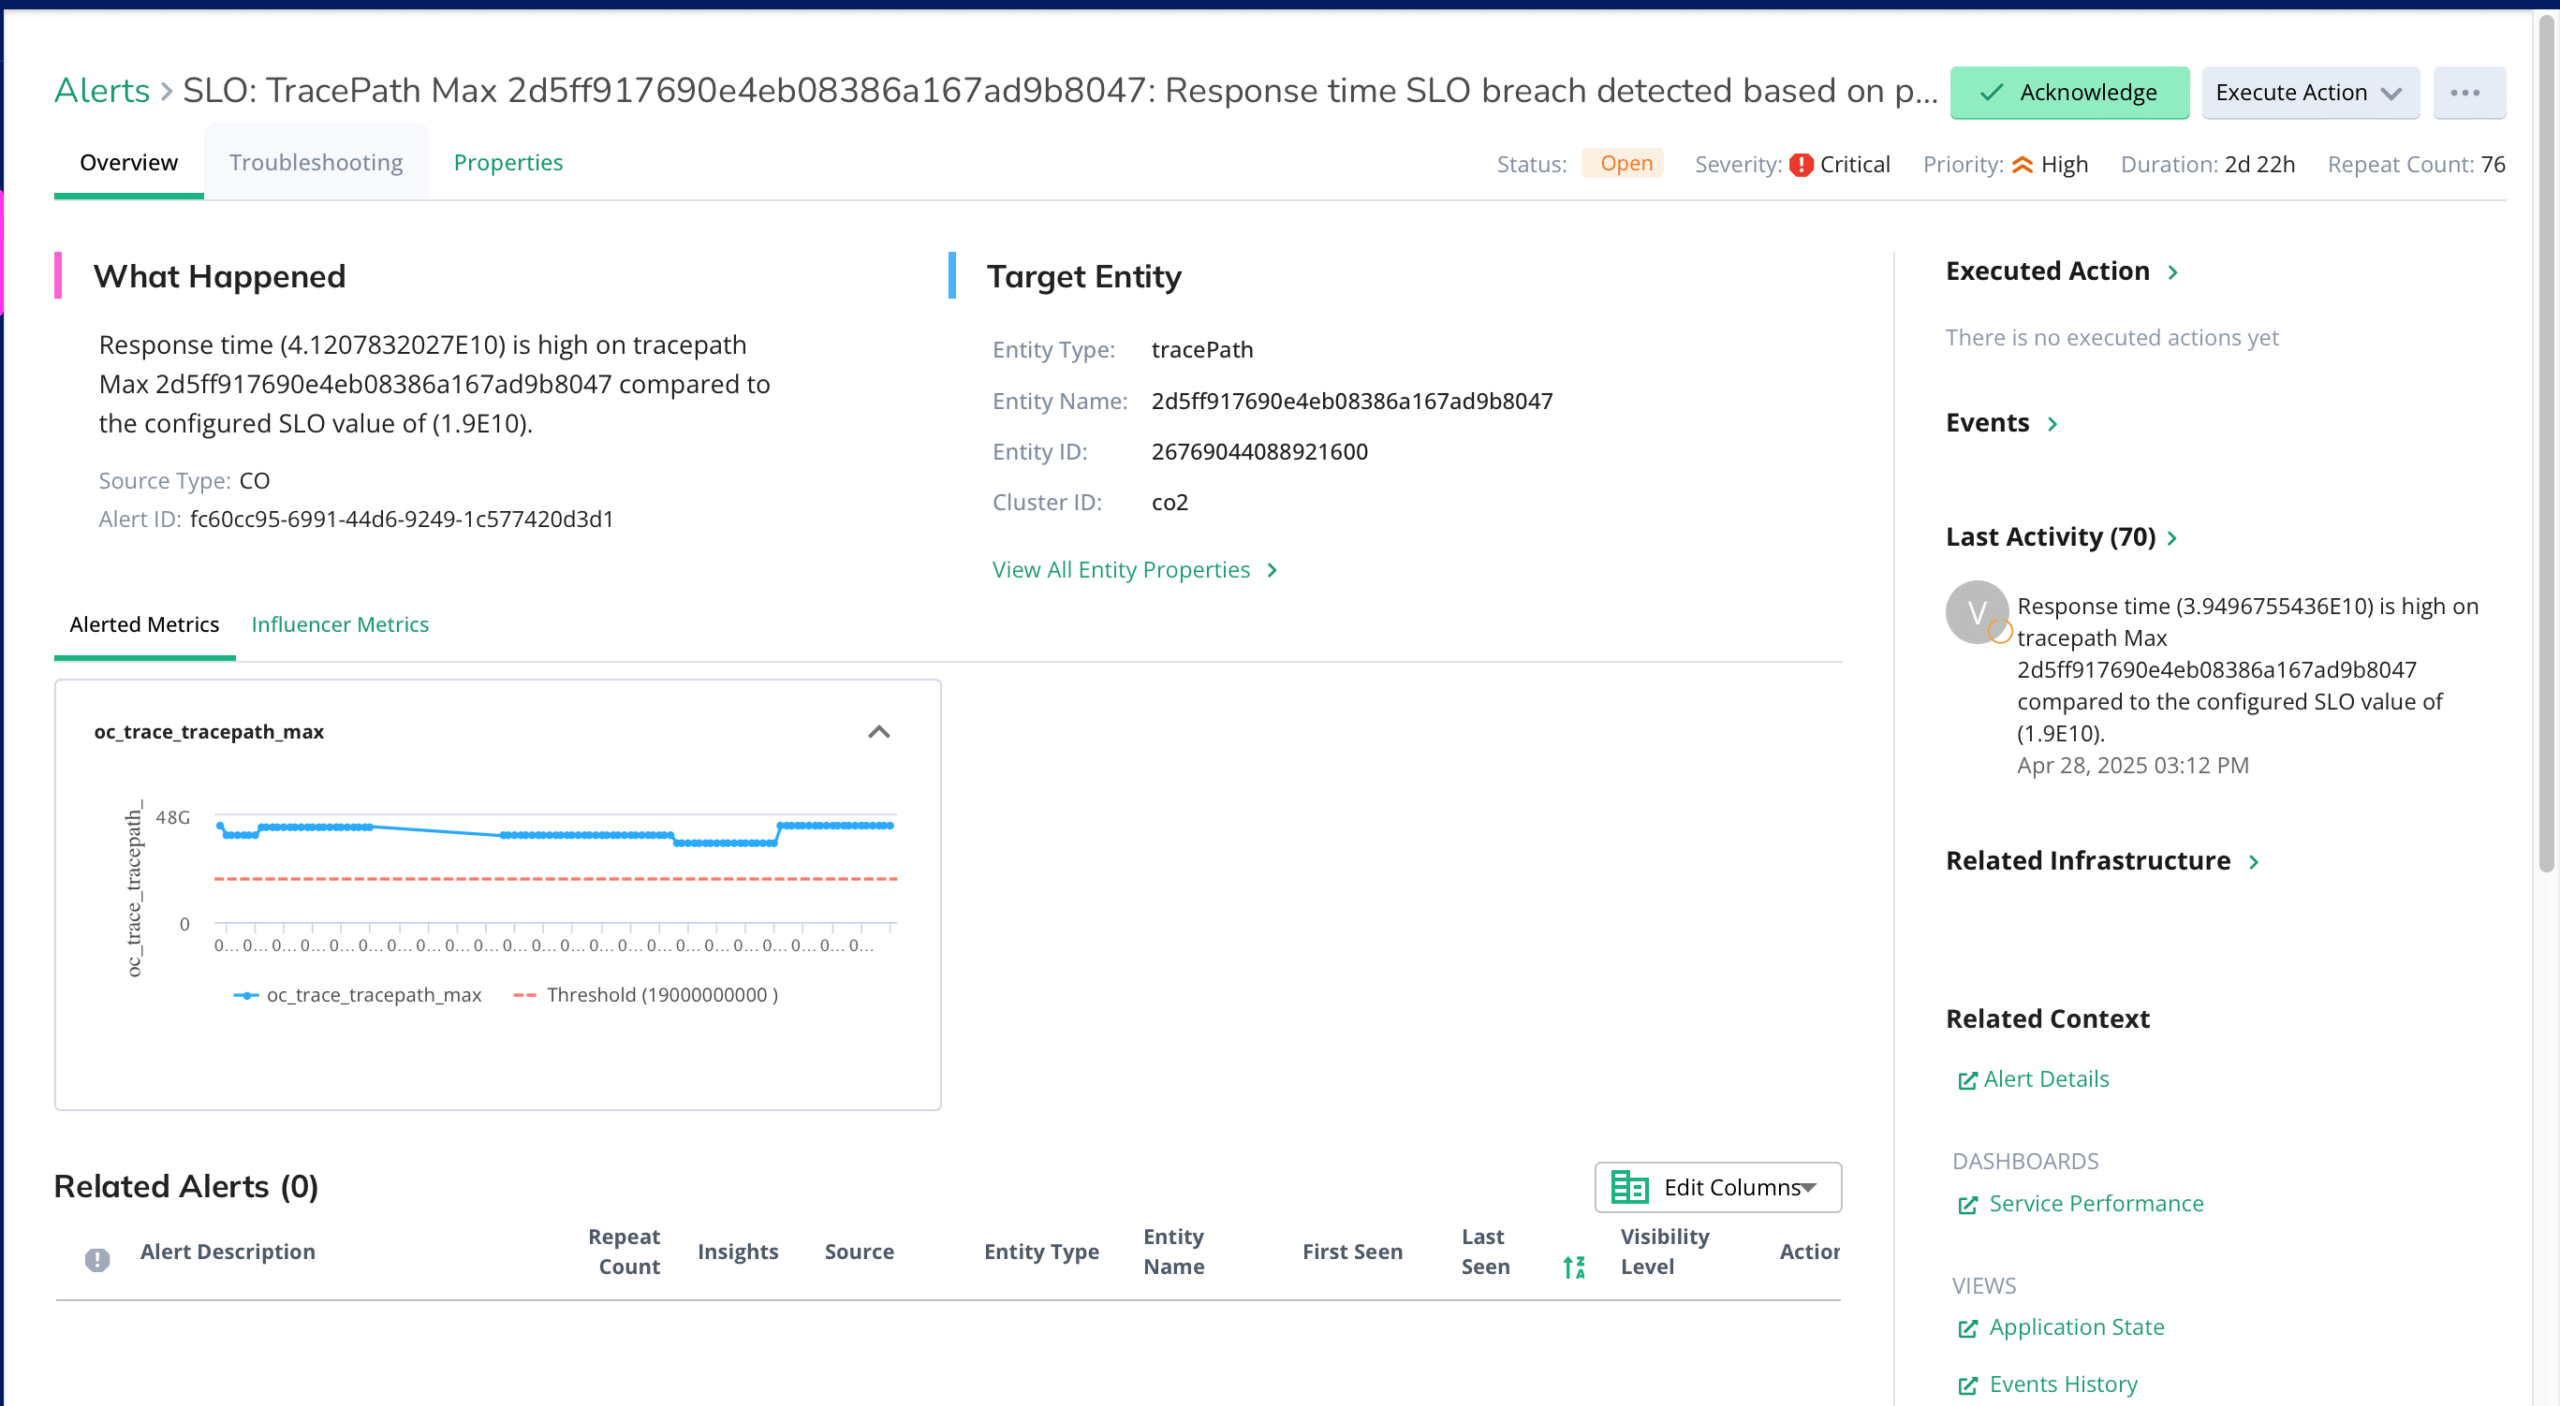
Watch for response-time changes, throughput drops, and resource saturation as inference demand grows.
Virtana adds infrastructure context to these changes, revealing whether traffic growth, GPU contention, storage latency, or network conditions contributed.
Teams can address emerging capacity pressure earlier and protect service levels as traffic and model workloads change.
Agent irregularities can increase even when application code remains stable.
Storage spikes can delay data access. GPU contention can slow inference. Network congestion can disrupt downstream interactions.
Virtana correlates these infrastructure events with the affected request path and service behavior.
Teams can determine whether the likely cause sits within a service configuration, Kubernetes placement, compute, network, or storage.
Application, platform, and infrastructure teams can investigate the same dependency evidence instead of reconciling separate alerts.
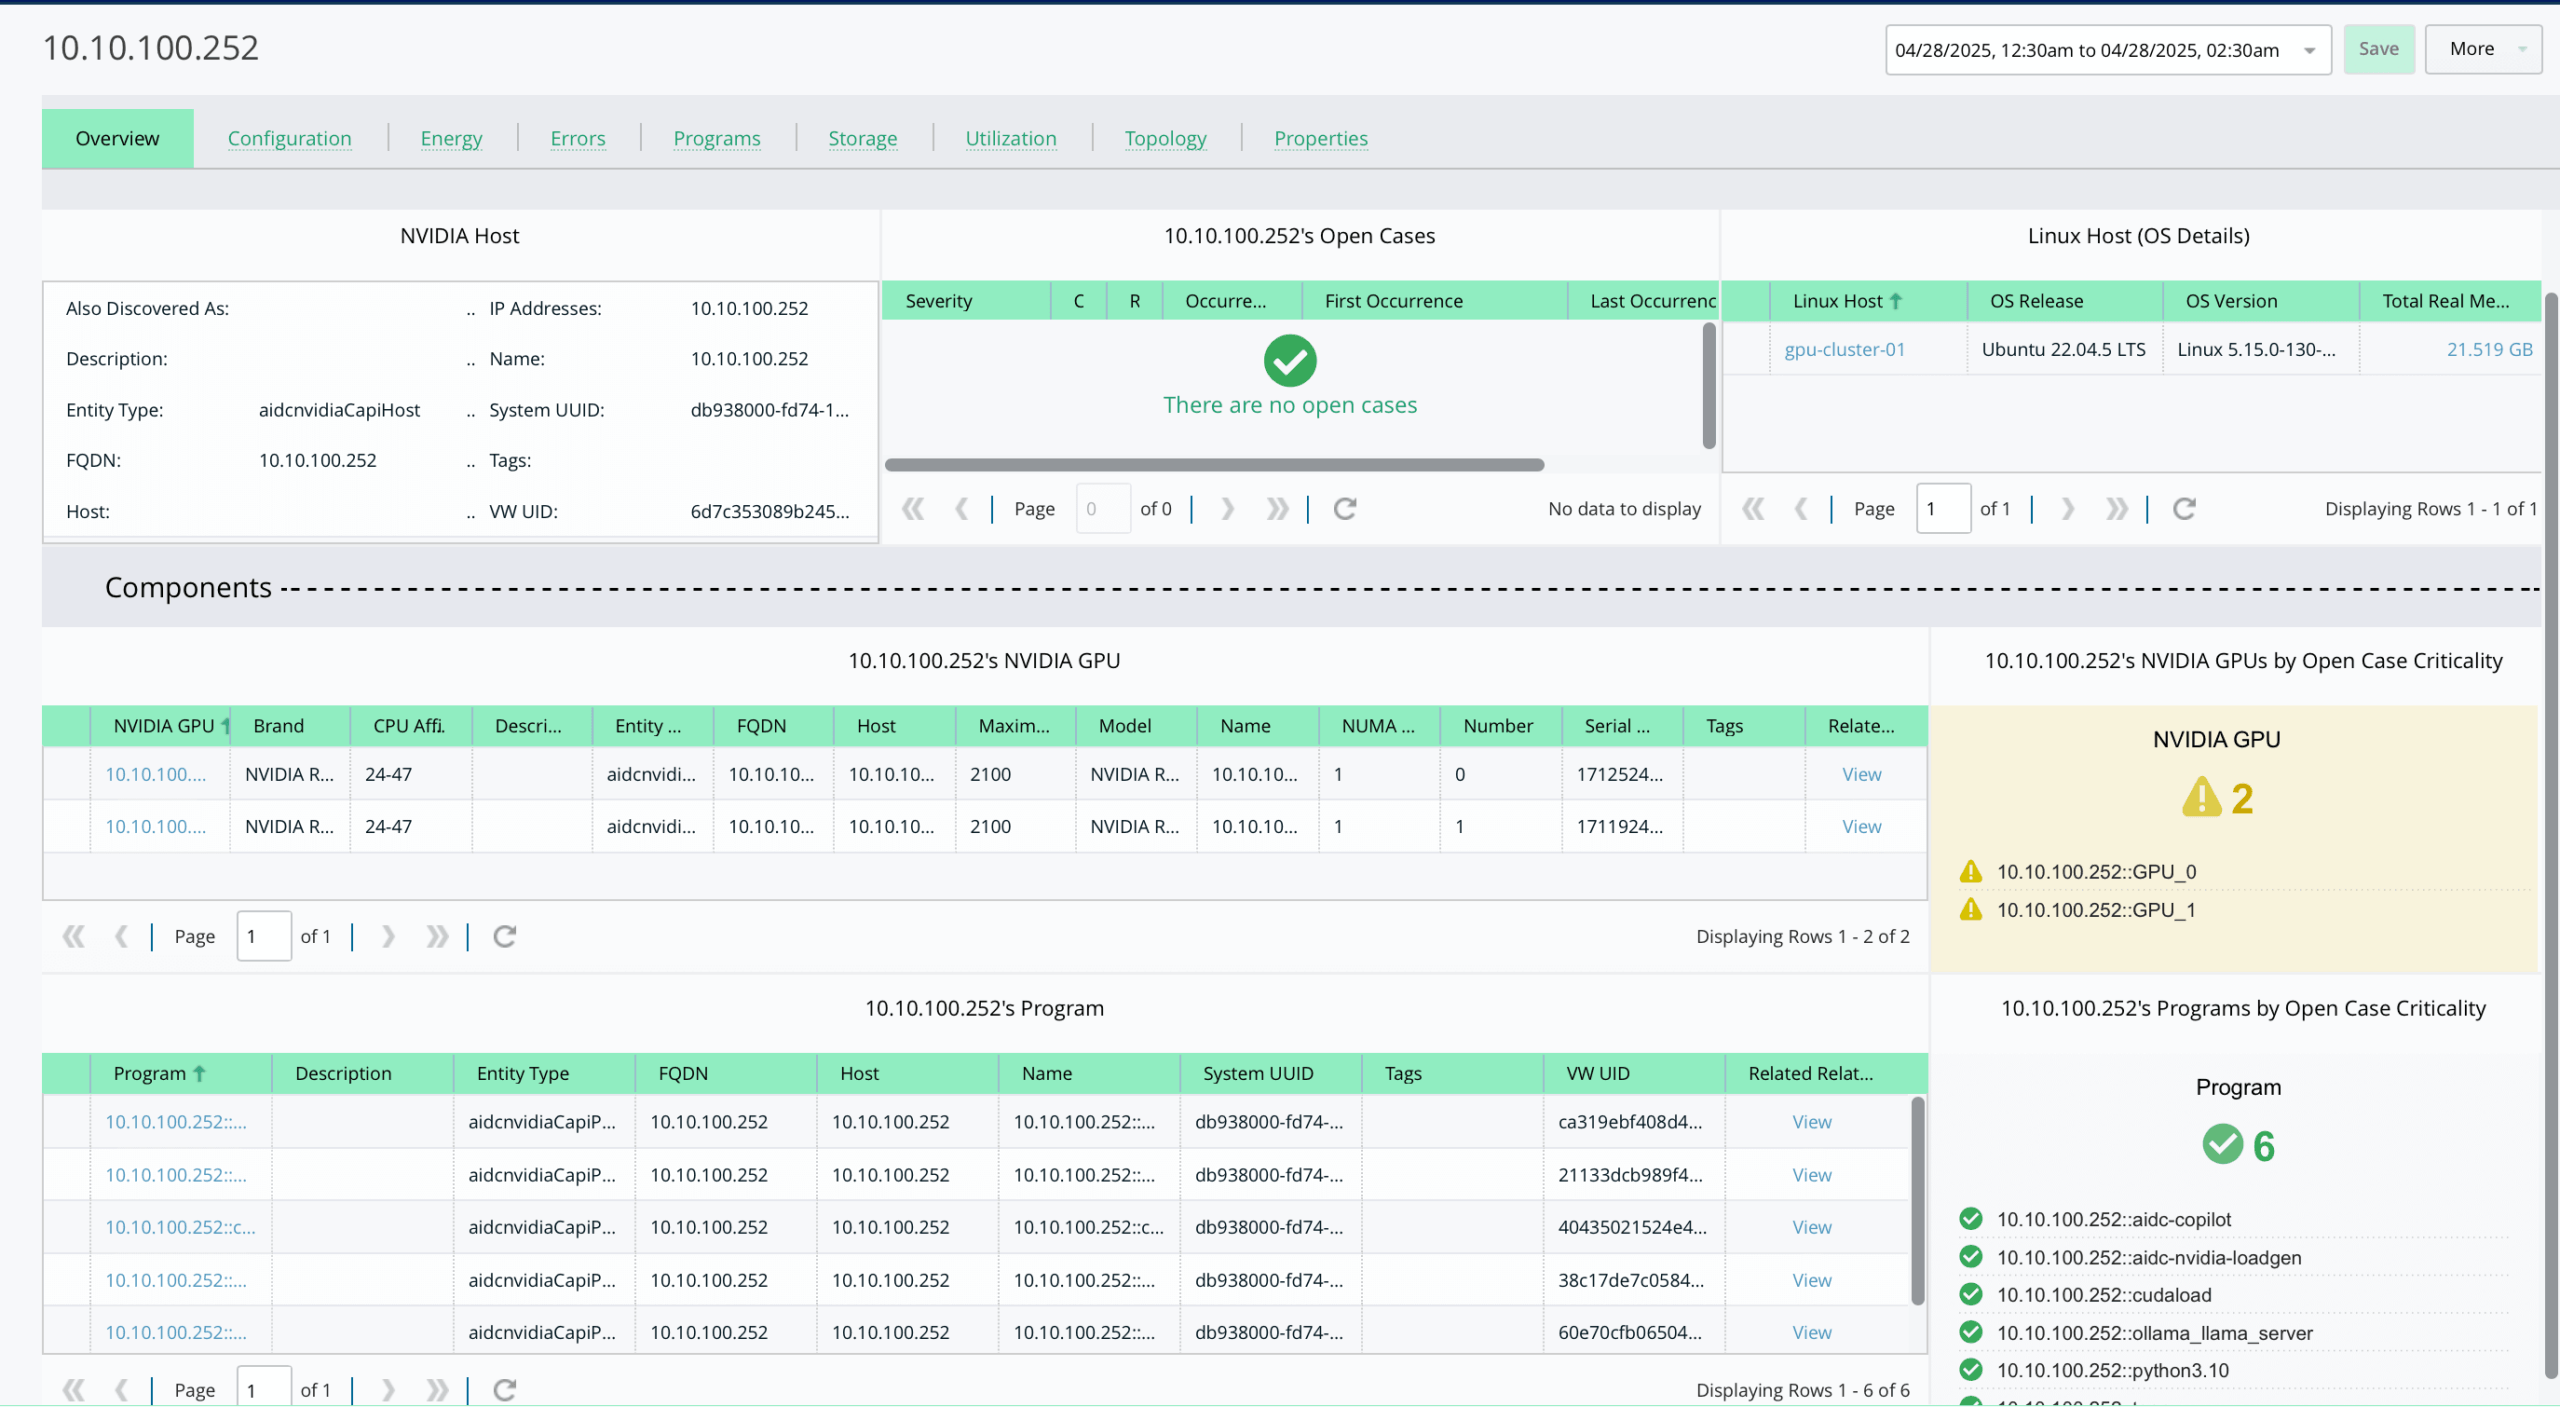
See where AI workloads are scheduled across Kubernetes clusters and which resources support them.
Identify poor pod placement, resource contention, and noisy-neighbor conditions affecting inference performance.
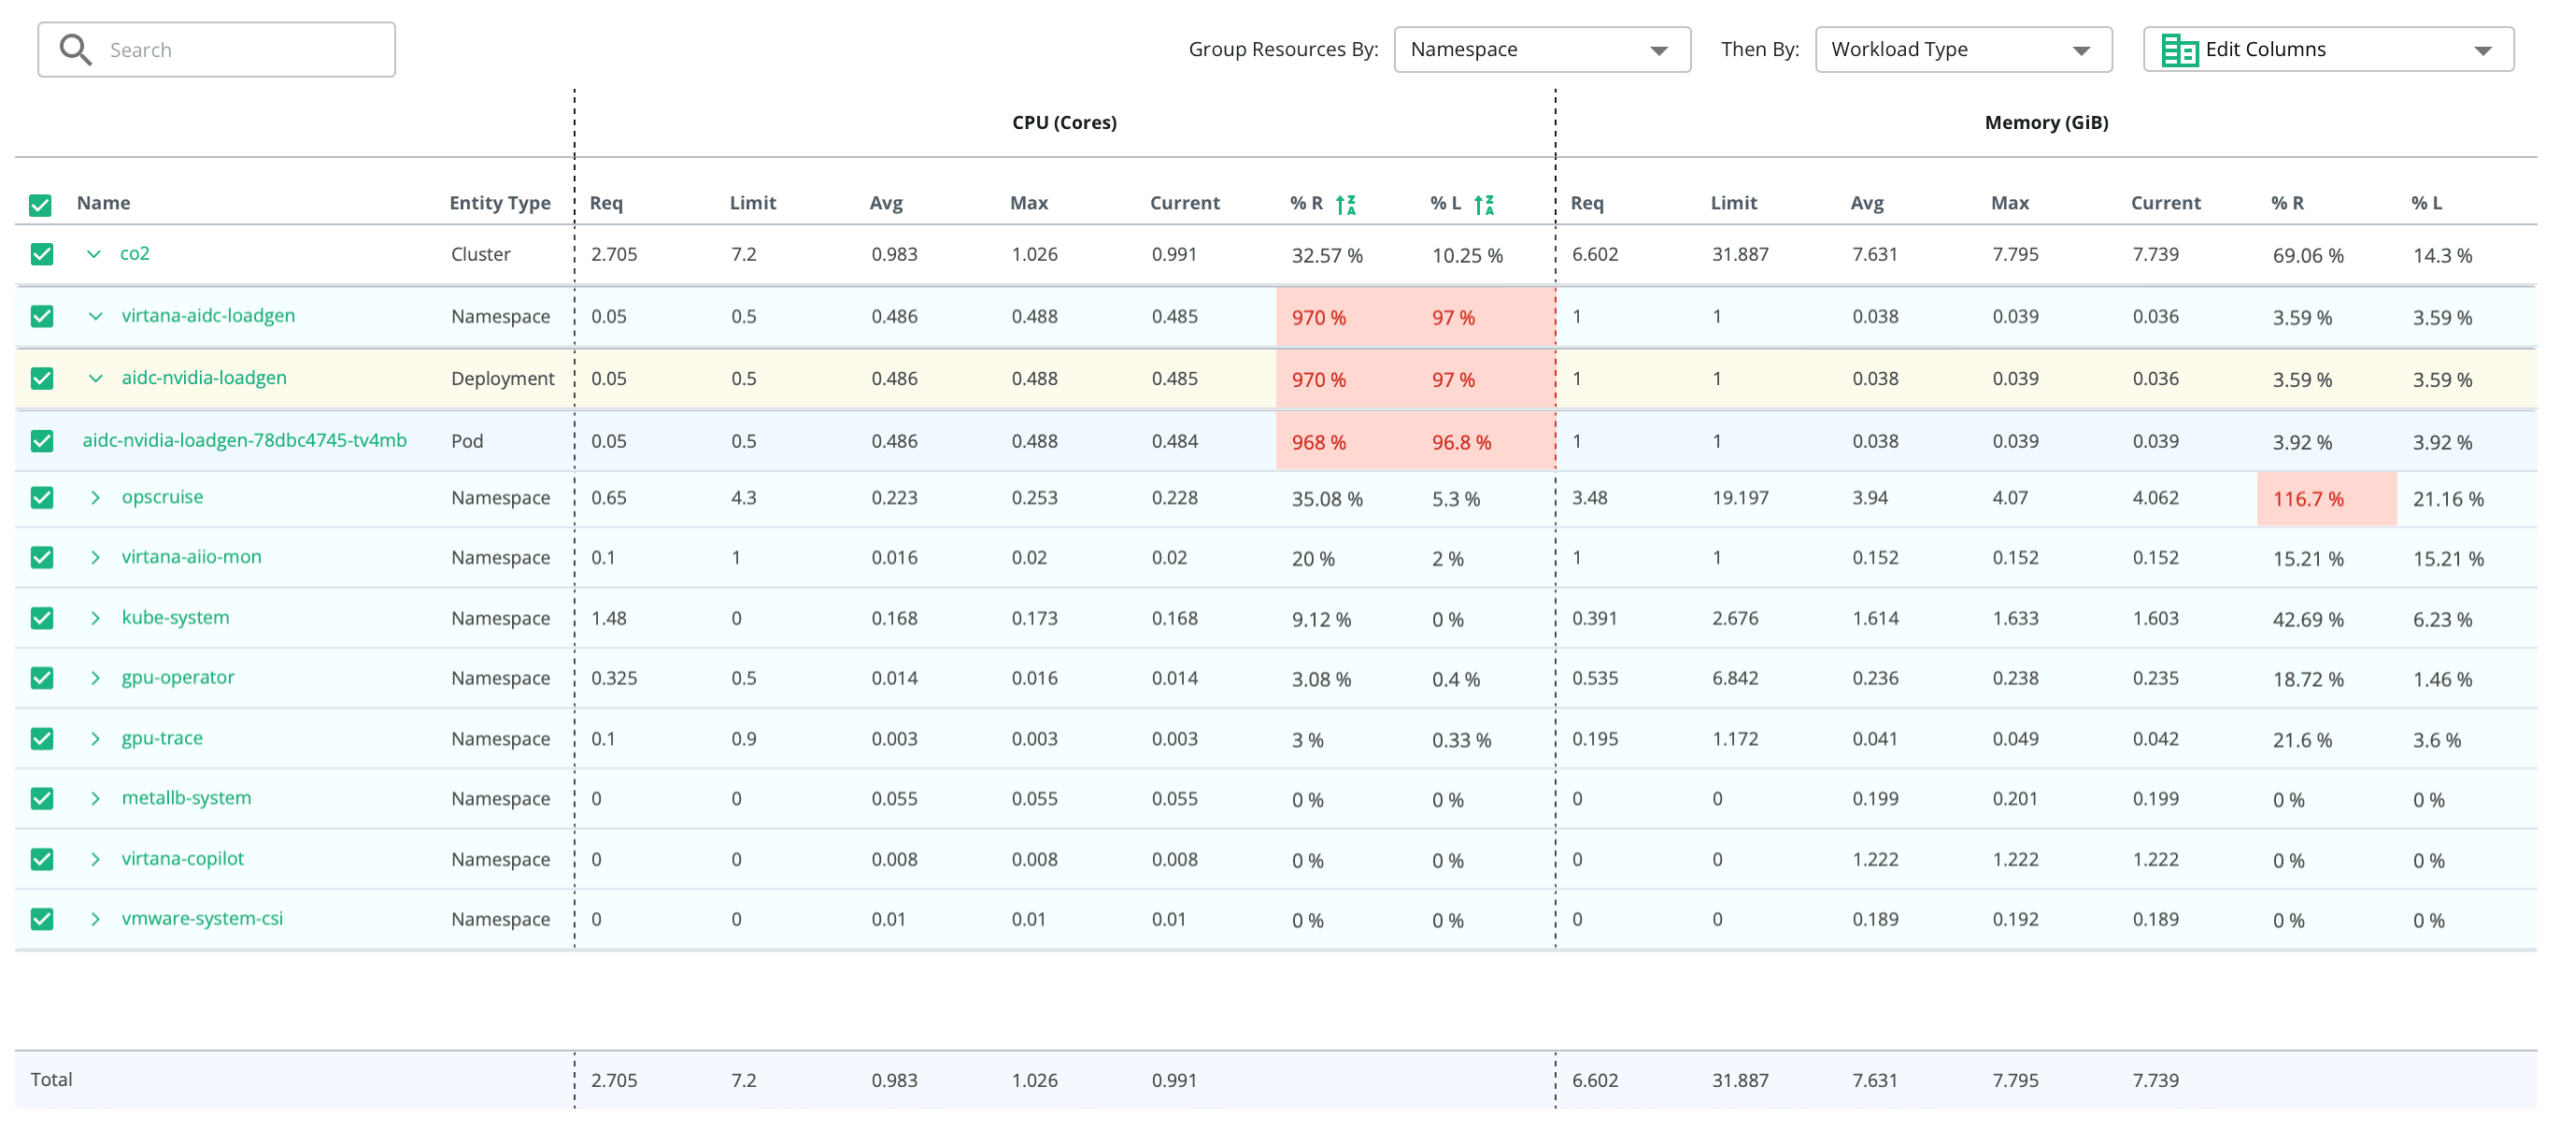
Compare where Kubernetes places each AI workload with available GPU, memory, network, and storage capacity before redistributing workloads.
Better placement can reduce idle GPU capacity while helping critical inference services receive the resources they need.
Track inference performance alongside token consumption, GPU utilization, energy use, and infrastructure demand.
Compare token demand with GPU and power use to identify workloads consuming disproportionate capacity.
Map resource consumption and performance changes to the business service each workload supports.
Leaders gain a clearer view of AI agent behavior, resource consumption, and service risk in production. They can use this evidence to guide capacity decisions and build a stronger case for future AI investment.
Support production AI within established governance, security, platform, infrastructure, and data-residency requirements.

Monitor supported AWS Bedrock Guardrails environments with model and infrastructure context
Give approved ChatGPT, Claude, Gemini, and Microsoft Copilot interfaces access to Virtana’s structured operational context through the MCP Server
Use OpenTelemetry collection and tracing across Kubernetes workloads, services, and infrastructure
Deploy through SaaS, self-hosted, or on-premises options based on operational and data-residency requirements
Understanding AI agents means seeing what they do and everything they depend on.
Virtana connects agent behavior with the applications, services, and infrastructure supporting it, then applies the Observe. Reason. Act. operating model:
Application, AI, platform, and infrastructure teams can investigate agent behavior and move from detection to evidence-backed response using the same operational context.
See how token demand, GPU use, capacity, and infrastructure cost shape AI returns
Learn how behavioral and infrastructure context supports AI operations in AWS Bedrock Guardrails environments
Learn what production teams should monitor as AI agent use grows
Virtana works across widely used telemetry standards, AI platforms, orchestration layers, GPU infrastructure, and virtualized environments.
Featured technologies: OpenTelemetry | MCP | AWS Bedrock | Kubernetes | NVIDIA | VMware

AI agent observability monitors the reliability, performance, resource use, and production behavior of AI agents. It connects request and inference activities to the applications, services, and infrastructure that support each workflow. Teams gain the context to pinpoint why an agent failed, slowed down, or consumed more resources than expected.
AI agent observability examines the agents your organization deploys in production and everything they depend on. An agentic observability platform goes further, using its own AI agents to investigate operational issues across the full technology environment.
Virtana’s Diagnostic and Remediation AI Agents use connected system context to identify likely causes, and recommend or take governed action.
Virtana helps teams identify performance constraints faster by combining AI-driven event correlation, intelligent root cause analysis, and live dependency context across hybrid environments.
Its System Dependency Graph reveals how infrastructure behavior in one layer affects connected services and workloads. That reduces manual cross-tool investigation. Agentic AI continuously analyzes system behavior to surface emerging constraints before they impact SLAs, helping teams shift from reactive troubleshooting to proactive operations.
Effective observability for AI agents should cover service health, inference latency, throughput, resource usage, token consumption, and request tracing. It should also include Kubernetes, GPUs, networks, storage, applications, and dependency context. Together, these signals help separate service symptoms from infrastructure constraints.
Yes. AI Factory Observability connects AI workloads with GPU, memory, power, data movement, and model-pipeline activity. Infrastructure Observability adds context across networks, storage, cloud, and on-premises resources.
Virtana supports OpenTelemetry collection and tracing to follow AI agent interactions across services, Kubernetes workloads, and the underlying infrastructure. The Virtana MCP Server also gives approved AI assistants and agents access to structured, system-aware operational context. Supported interfaces include ChatGPT, Claude, Gemini, and Microsoft Copilot.
It reveals performance degradation, along with the dependencies and business services exposed to risk. Teams can evaluate the affected dependencies and business services before choosing a response. Governed action can then support remediation in accordance with operational policies and approvals.