
AIX
Track AIX system status and performance over SSH.


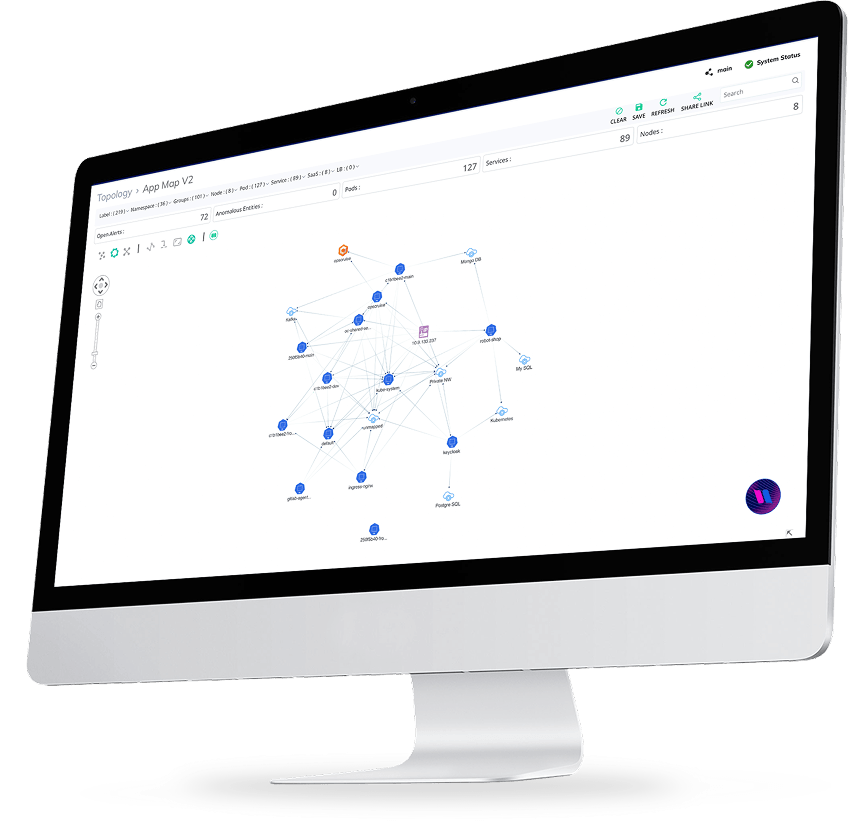
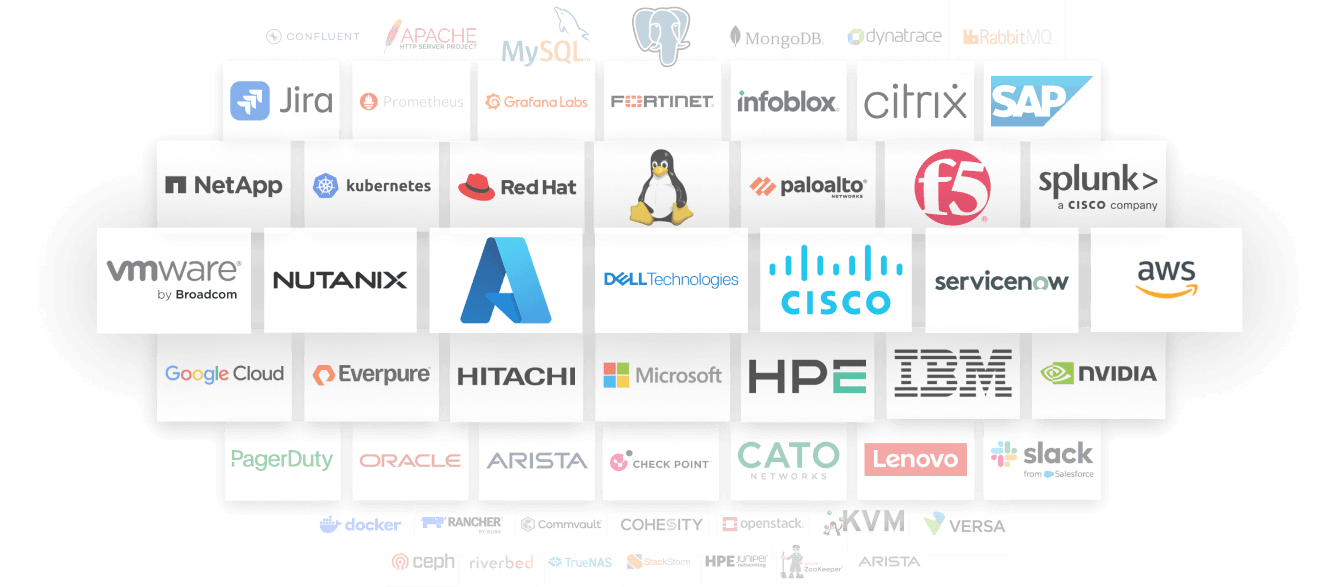
280+ integrations feed 25,000+ signals into one System Dependency Graph, so Virtana AI agents can build context, diagnose, control and govern across applications, services, AI factories and infrastructure.
Track AIX system status and performance over SSH.
Pull Amazon FSx metrics from CloudWatch alongside your container data.
Monitor EC2, VPC, RDS, S3 and more across your AWS accounts.
Track Apache web server performance via mod_status.
Track Kafka broker and JVM performance.
Monitor Tomcat application servers and their web apps.
Monitor Arista switches, set up by Virtana Professional Services.
Monitor Aruba (HPE) networking gear, set up by Virtana Professional Services.
See Brocade SAN fabric health, ports and performance alongside your storage.
Monitor Brocade SAN switches and their ports.
Model and monitor Cato Networks sites and devices via the Cato API, set up by Virtana Professional Services.
Discover and monitor Ceph storage clusters.
Confirm Check Point firewalls have policy installed and HA is healthy.
Monitor Cisco MDS Fibre Channel switches and fabric performance.
Monitor Cisco ACI fabrics through the APIC controller.
Monitor the health and performance of Cisco routers and switches.
Track Cisco Nexus switch health, interfaces and traffic.
Discover UCS domains, chassis, blades, fabric interconnects and service profiles in one view.
Monitor multiple UCS domains through Cisco UCS Central.
Map UCS Director tenants, virtual datacenters and VMs.
Monitor Cisco Unified Communications Manager and related apps.
Monitor Citrix NetScaler load balancers.
Monitor Citrix services, whether on-premises or in Citrix Cloud.
Monitor CloudGenix (Prisma SD-WAN) devices, set up by Virtana Professional Services.
Sync monitored devices with ServiceNow or other CMDBs.
Monitor Commvault backup environments, set up by Virtana Professional Services.
Monitor Confluent Cloud Kafka clusters on Microsoft Azure.
Monitor Cumulus Linux switches, set up by Virtana Professional Services.
Monitor multiple database instances on a single server.
Monitor Dell EMC Isilon clusters through the OneFS API.
Monitor Dell EMC XtremIO arrays through the XMS REST API.
Model and monitor Dell servers running OpenManage agents over SNMP.
Monitor Dell ObjectScale object storage capacity and performance.
Monitor Dell PowerEdge rack and blade servers, including VxRail.
Get visibility into Dell PowerFlex software-defined storage.
Monitor Dell PowerProtect data protection appliances.
Track Dell PowerScale (Isilon) cluster capacity and performance.
Monitor Dell PowerStore arrays, volumes and performance.
Monitor Dell Unity storage arrays and their workloads.
Get deep performance and capacity insight into Dell VMAX and PowerMax arrays.
Monitor Dell VPLEX storage virtualization clusters.
Track Dell XtremIO all-flash array health and performance.
Measure DNS lookup response times with dig.
Monitor any server that supports the Redfish API.
Measure the response time of DNS requests.
Monitor Docker and Podman containers on Linux hosts.
Reconcile Dynatrace applications and hosts with your infrastructure topology.
Get Container Observability alerts in your inbox.
Monitor Dell EMC ECS object storage, set up by Virtana Professional Services.
Monitor Dell EMC Unity arrays, set up by Virtana Professional Services.
Monitor Dell EMC VPLEX, set up by Virtana Professional Services.
Track F5 BIG-IP load balancer resources and virtual servers.
Monitor Fortinet FortiGate firewalls, set up by Virtana Professional Services.
Monitor resources deployed in Google Cloud.
Monitor GKE Autopilot clusters without managing nodes yourself.
Collect telemetry from Windows hosts with Grafana Alloy.
Monitor Hitachi Content Platform object storage.
Track Hitachi NAS file system capacity and performance.
Monitor Hitachi UCP Director availability and performance.
Monitor Hitachi UCP rack and chassis systems via SNMP.
Get performance and capacity insight into Hitachi VSP arrays.
Monitor HPE 3PAR arrays, set up by Virtana Professional Services.
Monitor HP ProLiant rack and blade servers via SNMP, iLO or WBEM.
Monitor HPE 3PAR, Primera and Alletra 9000 arrays.
Check website response times and confirm expected content is on the page.
Monitor IBM Db2 databases on Linux, Unix and Windows.
Monitor IBM Power servers through the HMC interface.
See IBM PowerVM LPARs and host performance in one place.
Discover IBM SVC IO groups, volumes and their relationships, with real-time performance.
Monitor IBM WebSphere Application Servers.
Push events into your incident management tool, set up by Virtana Professional Services.
Monitor Infinidat InfiniBox capacity and performance.
Monitor Infoblox DNS, DHCP and IPAM appliances, set up by Virtana Professional Services.
Monitor Ethernet switches of any vendor over SNMP.
Bring existing Jaeger traces into Virtana without re-instrumenting your services.
Collect metrics from any Java application with a JMX agent.
Monitor JBoss application servers through JMX.
Create and track Jira work items from Virtana alerts and changes.
Monitor Juniper routers, switches and firewalls.
Add deeper monitoring for Juniper MX, QFX, EX and SRX devices.
Monitor Juniper NetScreen firewalls over SNMP.
Monitor Kubernetes clusters on GKE, EKS, AKS, OpenShift or on-prem.
Discover clusters, nodes and pods and track their health through the Kubernetes API.
Support for KVM Host and Virtual Machine infrastructure.
Collect performance and health metrics from your Linux hosts.
Monitor Linux health, disks, LVM, services and processes over SSH.
Watch log files and directories for size changes or pattern matches.
Search and correlate container logs collected by Grafana Loki.
Monitor Cisco Meraki networks, set up by Virtana Professional Services.
Monitor Azure subscriptions and resources through the Azure REST API.
Monitor Microsoft Exchange Server performance.
Monitor Hyper-V hosts and virtual machines.
Monitor Microsoft Lync / Skype for Business messaging.
Discover MSMQ queues and track how many messages are waiting.
Monitor Windows servers via WinRM and WMI.
Monitor MongoDB servers and their individual databases.
Monitor MySQL servers and databases.
Monitor NetApp storage systems, volumes and performance.
Track NetApp NFS/CIFS operations and file system and snapshot usage.
Analyze network traffic flows to see who is talking to whom, and how much.
Make sure your NTP servers stay in sync with their peers.
Track Nutanix clusters, hosts and VMs.
Track GPU utilization, memory and health for AI/ML workloads through NVIDIA DCGM.
Monitor NVIDIA NIM inference microservices alongside the GPU infrastructure that serves them.
Monitor OpenStack from the service provider's side, including the underlying servers.
Monitor OpenStack flavors, images and servers from a tenant's view.
Ingest OpenTelemetry traces, logs and metrics from AI training and inference services to tie model behavior to the GPUs underneath.
Send Service Observability events to PagerDuty services.
Model and monitor Panorama and Palo Alto Networks firewalls, set up by Virtana Professional Services.
Embed Service Observability data in external portals via the JSON API.
Monitor PostgreSQL servers, databases and tables.
Capture Fibre Channel wire data for real-time SAN performance analysis.
Bring your Prometheus metrics into Container Observability.
Pull Virtana IO data into your own tools and scripts.
Track Pure FlashArray health, capacity and performance.
Monitor Pure Storage arrays, set up by Virtana Professional Services.
Monitor RabbitMQ brokers, queues and exchanges.
Monitor Kubernetes clusters managed by Rancher.
Monitor OpenShift clusters and the workloads running on them.
Collect vendor-neutral server hardware health and telemetry over the DMTF Redfish API.
Model and monitor devices running dynamic routing protocols.
Monitor SAP HANA databases, set up by Virtana Professional Services.
Raise ServiceNow incidents from Container Observability alerts.
Open and track ServiceNow incidents automatically from Virtana alerts.
Sign in to Service Observability with your SAML identity provider.
Send Virtana alerts straight to your Slack channels.
Forward Virtana alerts as SNMP traps to your existing event tools.
Collect performance and health metrics from your Solaris hosts.
Ingest logs and alerts from Splunk when it's your chosen log provider.
Map AppDynamics-monitored applications to the infrastructure beneath them.
Test the availability and speed of your SQL databases with custom queries.
Trigger automated StackStorm remediation workflows from Virtana alerts.
Monitor VMware VeloCloud SD-WAN, set up by Virtana Professional Services.
Monitor Versa SD-WAN devices through Versa Director, set up by Virtana Professional Services.
Monitor Cisco Viptela SD-WAN, set up by Virtana Professional Services.
Access alerts and dashboards across all Virtana products programmatically.
Let AI assistants query your Virtana data through the Model Context Protocol.
Monitor Kubernetes clusters managed by VMware Tanzu.
Discover and monitor your vSphere hosts, VMs and datastores through vCenter.
Monitor your vSphere environment through vCenter.
Collect metrics from any WBEM provider with CQL queries.
Monitor multi-step web transactions such as logins.
Run synthetic browser transactions to test website availability and speed.
Collect performance and health metrics from your Windows servers.
Collect metrics from any WS-Management provider.