Infrastructure Performance Monitoring
Introduction
Enterprises run on technology. The health of their IT infrastructures can make or break their ability to operate efficiently, evolve competitively, and innovate strategically—which means that IT teams need to be able to monitor their infrastructures effectively. This six-part series covers infrastructure performance monitoring (IPM), including what it is and how it can help your business. And it will dive into some of the metrics, tools, and technologies to maximize the value of your infrastructure monitoring strategies.
What is infrastructure performance monitoring (IPM)?
Infrastructure performance monitoring is exactly what the name implies—monitoring the performance of your infrastructure. Let’s examine each of those words in turn.
- Infrastructure is the entire set of physical, software, network, and other components within your IT environment. Modern infrastructures typically include a data center environment with physical and virtual machines that you own and operate, as well as cloud infrastructure.
- Performance refers to the availability and responsiveness of applications and services within the infrastructure. But it’s much more than response times and resource utilization—it also encompasses SLAs, KPIs, costs, and other important considerations.
- Monitoring is the process of understanding the key characteristics of all the components within your infrastructure on an ongoing basis—confirming they are operating as expected and identifying when they are not.
Taken all together, IPM is about having ongoing visibility into the overall health of your entire IT ecosystem so you can manage it effectively to ensure it operates at optimal levels.
What are the benefits?
Gain hybrid cloud visibility
A good infrastructure performance monitoring tool will provide visibility into all aspects of your infrastructure—on premises, private cloud, and public cloud. And it will provide insights into how that hybrid cloud infrastructure is connected, which applications, hardware, and other components and services it’s supporting , and how it all is performing under load.
Minimize downtime
Infrastructure performance monitoring helps you identify problems that aren’t causing significant issues yet but may be heading toward impending downtime. This enables you to take action before they reach critical levels, potentially leading to substantial losses in revenue, employee productivity, and business reputation.
Streamline troubleshooting
Because IT infrastructures are so complex, when a problem does arise, it can be challenging to pinpoint the source. When multiple teams and vendors are involved, it can further complicate the process. The insight from infrastructure performance monitoring can cut through the complexity and inevitable finger-pointing to get to the root cause more quickly.
Improve customer (and employee) satisfaction
IT infrastructure is one of those things that, when it’s working, is invisible. Unfortunately, this means that you usually don’t get credit when all’s well, but you will get an earful if—when—something goes wrong. Because infrastructure performance monitoring helps detect issues sooner and resolve them faster, you can minimize the impact on external and internal end users.
Increase business agility
Infrastructure performance monitoring enables organizations to detect new trends and patterns in usage behavior, enabling them to adjust processes, capacity, and more. This allows them to proactively understand and keep up with changing demands.
Manage costs and risk
All decisions about your infrastructure come with associated costs and risks. Infrastructure performance monitoring provides you with comprehensive data—not just about individual components but also the context in which they operate—so you can make more informed decisions that appropriately balance cost and risk trade-offs for your organization.
IPM Deep Dive
There’s a lot to IPM. This series discusses key concepts and provides guidance to help you build an effective infrastructure performance monitoring strategy for your enterprise.
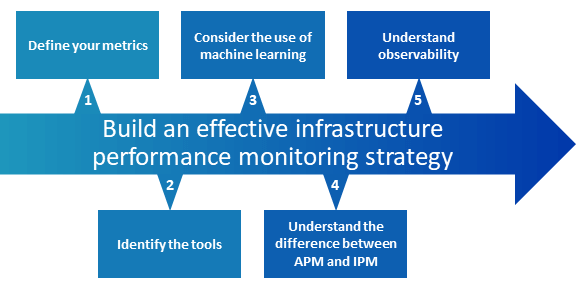
1. Define your metrics
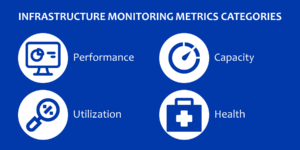
Metrics are the foundation for critical decision-making to ensure your infrastructure delivers the ongoing support your organization needs to operate efficiently and cost-effectively. Most infrastructure metrics can be categorized into the following groups: performance, utilization, capacity, and health. And because each resource type plays a distinct role in the tech stack, there’s a tremendous variety of metrics available for you to monitor, including compute, network, storage, and application. This chapter provides a comprehensive list of the common performance, utilization, capacity, and health metrics for each of the different resource types. It also covers what you can do with infrastructure monitoring metrics as well as some infrastructure monitoring metrics challenges.
2. Identify the tools
Infrastructure monitoring tools capture a range of metrics and performance indicators to help businesses ensure that all the physical and virtual elements of their infrastructure are functioning optimally. Learn the difference between monitoring tools and platforms—and why it matters—and what to look for in an infrastructure monitoring platform.
3. Consider the use of machine learning
Machine learning (ML) is a subset of artificial intelligence that involves training algorithms to learn and make decisions based on data. Read this article to learn about the use of machine learning in infrastructure performance monitoring, as well as the benefits of using ML in IPM and how to implement machine learning in your IPM strategy.
4. Understand the difference between APM and IPM
In IT, performance monitoring is the process of ensuring that all technology-based systems are meeting availability, service-level, budget, and other requirements of the enterprise. But there are different kinds of performance monitoring. This article discusses APM (what it is, who benefits, and its limitations) and IPM (what it is, who benefits, data sources, use cases, and limitations). It also introduces application-centric IPM and why it’s essential.
5. Understand observability
The terms “observability” and “monitoring” are sometimes used interchangeably, but there is a difference between the two. Observability relies on monitoring but goes further to explore patterns and properties that are not defined in advance, delivering visibility into the health and performance of your entire infrastructure as one holistic environment. This chapter details the difference between monitoring and observability, discusses the role of log analysis and machine learning in observability, and highlights the wide-ranging benefits of observability.
IPM is a critical component of infrastructure management
Without the full-stack visibility of IPM, you are flying blind. Even if you have other tools that provide insights into portions of your infrastructure, you’ll still have gaps. You may understand the health of those individual components or segments, but that is insufficient to understand the health of your overall IT infrastructure. Given the strategic importance of IT infrastructures, monitoring performance across your entire global hybrid cloud infrastructure is a non-negotiable must-have.
Infrastructure Monitoring Metrics
What are infrastructure monitoring metrics?
In the world of IT, there are many metrics that can be collected and analyzed to understand the health of a system. Infrastructure monitoring metrics are those that are specific to servers, virtual machines, storage, networks, applications, operating systems, and other components—in other words, everything that makes up your IT infrastructure.
It’s not worth collecting data just for the sake of collecting data. Metrics are the means to an end—they are the foundation for critical decision-making to ensure your infrastructure delivers the ongoing support your organization needs to operate efficiently and cost-effectively. This includes alerting you to changes so you can preempt impending negative impacts, as well as visualizing longer-term trends to improve planning and budgeting.
Most infrastructure metrics can be categorized into the following groups:
- Performance metrics measure the ability of the infrastructure components to meet workload requirements or application demand. This includes latency, which measures how long it takes for a request to be processed and returned. Latency problems can be a direct cause of performance issues.
- Utilization metrics measure the percentage of available processing being used to handle resource demands and workload volumes.
- Capacity metrics measure whether your infrastructure can handle current and anticipated resource demands and workload volumes.
- Health metrics measure the overall condition of the underlying infrastructure supporting the organization’s applications and workloads.
Issues in any of these areas can impact the availability of applications and workloads, as well as the cost of maintaining your infrastructure.
What types of metrics are there?
Every resource across your entire IT infrastructure generates data about its operation. Because each resource type plays a distinct role in the tech stack, there’s a tremendous variety of metrics available for you to monitor, including:
- Compute: Resources and processes related to computation and processing
- Network: Transmission of data across components in the infrastructure
- Storage: Access to data by the systems and processes that need to use it
- Application: Software designed to carry out a specific task
Here is a list of common performance, utilization, capacity, and health metrics for the different resource types.
Performance metrics
Compute performance metrics
- % CPU ready: Percentage of time a virtual CPU is ready to run, but is not being scheduled on a physical CPU. This is helpful to identify CPU contention (i.e., there is not enough physical CPU to schedule the work immediately).
- Memory state or memory pressure: Amount of free memory or the proportion of memory consumed. This indicates if there is contention for memory, which means performance-impacting swapping between memory and disk is occurring.
- Physical device read/write latency: Amount of time it takes to complete a command from the host or datastore.
- Average read/write completion time: Amount of time it takes to complete a read or write command from the host to the storage.
TCIP/IP network performance metrics
- Window closed: How many times the TCP window has been reduced to less than 4K in size.
- Pause frames: Count of read or write transaction pause frame requests (i.e., request to stop data transmission until receiver can catch up).
Storage performance metrics
- Average read/write completion time: Amount of time it takes the storage array to respond to a read or write command.
- % time at zero buffer credits: Percentage of time the storage device reports that it has no available buffer credits (flow control).
Application performance metrics
- Average read/write completion time: Amount of time it takes to complete a read or write command from the application to the storage.
Utilization metrics
Compute utilization metrics
- CPU utilization: Percentage of processing resources utilized to run the workload.
- Memory utilization: Percentage of memory resources utilized to run the workload.
- Network receive/transmit rate: Rate at which data is received/transmitted by the virtual machine.
- HBA port utilization: Percentage of actual traffic volume against the maximum volume that can be handled by the HBA port.
- IOPS:Count of input/output operations per second.
FC SAN network utilization metrics
- Switch port utilization: Percentage of actual traffic volume against the maximum volume that can be handled by the switch port or port channel.
- Throughput: Rate of message delivery over the network.
TCP/IP network utilization metrics
- IOPS: Count of input/output operations per second.
- Concurrent connections: Number of concurrent threads on the server.
- Throughput: Rate of message delivery over the network.
- Transmitted packets: Count of transmitted network packets.
Storage utilization metrics
- Storage port utilization: Percentage of actual traffic volume against the maximum volume that can be handled by the storage port.
Capacity metrics
Compute capacity metrics
- CPU usage: Sum of the actively used CPU.
- Memory usage: Sum of the memory granted, used, or active.
- Disk usage: Amount of virtual disk used by a virtual machine.
- Port usage: Amount of the maximum HBA port capacity that has been consumed.
Network capacity metrics
- Port usage: Amount of the maximum switch port capacity that has been consumed.
Storage capacity metrics
- Usable capacity: Total available capacity on the storage device.
- Provisioned/subscribed capacity: Total capacity that has been allocated for use on the storage device.
- Used capacity: Total capacity that is in use on the storage device.
- Port usage: Amount of the maximum storage port capacity that has been consumed.
Health metrics
Compute health metrics
- VM vMotion count: Count of VM vMotions (a zero-downtime live migration of workloads from one server to another).
- Commands aborted: Count of aborts (i.e., commands to terminate an IO transaction that has timed out or encountered an error).
- Dropped packets: Count of network packets dropped due to an issue like network congestion, hardware misconfiguration, software bug, or a security breach.
- Consumed bandwidth: Amount of data consumed by a host, measured whether the consumed bandwidth is balanced across the host’s HBA ports.
FC SAN network health metrics
- Received/transmitted CRC errors: Count of the number of CRC (cyclic redundancy check) errors transmitted or received by the switch port. A CRC error occurs when a frame containing a bad CRC checksum is received by a switch. When this happens, it means that some portion of the frame or its data has been corrupted and must be re-sent.
- Other frame errors: Count of the number of frame errors detected by the switch port. Frame errors occur when a frame with an embedded code violation or other bit-level error within the frame is detected.
- Loss of synchronization: Count of the number of loss-of-synchronization events detected by the switch port. Loss of synch occurs when two devices lose the synchronization signal between them for a specific period.
- Loss of signal: Count of the number of loss-of-signal events detected by the switch port. Loss of signal occurs when the amount of light on the receiver drops below a specified threshold.
- Class 3 discards: Count of the number of Class 3 discard events detected by the switch port. Class 3 discards occur when a switch receives a frame but is unable to pass it along to the next point on the path to its destination.
- Link resets: Count of the number of link-reset events detected by the switch port. Link resets occur when the port has either received or transmitted a link reset command.
- Link failures: Count of the number of link-failure events detected by the switch port. Link failures occur when the port has been in a loss-of-synch or loss-of-signal state for a specific period or has failed to respond to a link reset command.
- Aborts: Count of the number of abort commands issued by the switch. Abort commands are used to clean up transactions that have timed out due to failure.
TCP/IP network health metrics
- Read/write errors: Count of errors occurring on a read or write transaction.
- Access/lookup errors: Count of errors occurring on an access or lookup transaction.
- CRC error: Occurs when a frame containing a bad CRC checksum is received by a switch. When this happens, it means that some portion of the frame or its data has been corrupted and must be re-sent.
- Loss of synch: Occurs when two devices lose the synchronization signal between them for a specific period.
- Loss of signal: Occurs when the amount of light on the receiver drops below a specified threshold.
- TCP/IP checksum: TCP and IP use 16-bit checksums to check the validity of the data being transported from point A to B.
- Ethernet code error: Error at the physical layer of the Ethernet protocol.
- Packet errors: Duplicate, oversize, or out-of-order packets.
What can you do with infrastructure monitoring metrics?
Gathering and monitoring infrastructure performance metrics is only useful if you know what to do with the data you are collecting—how to analyze it, interpret it, and then act on it. There are various ways you can use the
information, including:
- Analyzing historical data
- Visualizing information with dashboards
- Detecting trends
- Identifying anomalies
- Alerting in real time
By taking these actions with metrics, you can achieve a wide range of outcomes. Here are just a few examples:
- Plan capacity
- Prevent downtime
- Ensure application service levels are met
- Assure application performance
- Ensure workloads are balanced across the compute infrastructure
- Reduce mean time to resolution (MTTR) for infrastructure issues
- Reduce capital expenditure by optimizing utilization of infrastructure resources
No matter what you are looking to accomplish, there are metrics available that can help you get smarter about your infrastructure and make better decisions for your organization—assuming you have the right collection and analysis tools and capabilities in place.
Infrastructure monitoring metrics challenges
The typical enterprise has a wide variety of data-producing systems across the infrastructure. Instrumentation to collect millions—or even billions—of data points with consolidation for easy, accurate analysis is a challenge. A lot of tools look at data that’s collected every 5 or 10 minutes, which means you’re missing a lot of what actually happened in the infrastructure. Some tools average the data over time, but this can bake inaccuracies into the information. To get the most value from your infrastructure monitoring metrics, you want the highest granularity of data that is collected at the highest frequency. And to make all the data usable—and actionable—you want to be able to leverage visualization, real-time data correlation, and AI-powered recommendations all from a single pane of glass.
Get the most from your infrastructure monitoring metrics with Virtana
Virtana Infrastructure Performance Management, part of the Virtana Platform, delivers infrastructure monitoring metrics for full-stack visibility. It’s the only solution that combines massive ingest of wire, machine, and ecosystem data with AIOps, machine learning (ML), and data-driven analytics and observability to ensure cost-effective performance and availability of your mission-critical hybrid infrastructure.
Infrastructure Monitoring Tools
Introduction
In the previous articles of this series, we introduced infrastructure performance monitoring (IPM) and detailed the types of metrics that are used. This article covers infrastructure monitoring tools: why you need them, what they include, and what to look for.
What is an infrastructure monitoring tool?
An infrastructure monitoring tool is monitoring software that captures a range of metrics and performance indicators to help businesses ensure that all the physical and virtual elements of their infrastructure—network, storage, applications, hardware, cloud servers, etc.—are functioning optimally.
Monitoring tool vs. platform—what’s the difference, and does it matter?
Tools tend to have a single use or function that is specific to only one area or component of the infrastructure. For example, you might use a tool to monitor and gather data from individual servers or a particular segment within your overall infrastructure, such as the network. A monitoring platform, which is more deeply integrated within your infrastructure, gathers a broader range of data from multiple systems to provide a better picture of your overall environment. Platforms also tend to offer additional functionality, such as reporting or alerting when something goes wrong or certain thresholds are exceeded. While tools are useful to manage discrete elements within your infrastructure, it isn’t easy to manage and optimize a diverse and complex infrastructure with just tools. There are simply way too many, and because they don’t typically talk to each other, you could end up spending more time managing the tools than you do the actual infrastructure. Platforms don’t always replace those tools, though in some cases they can. They ingest the data from many tools—and potentially even gather additional data themselves—and consolidate it to deliver infrastructure-wide insights and recommendations.
What to look for in an infrastructure monitoring platform
The goal of an infrastructure monitoring platform is to enable you to understand what is happening within your infrastructure both right now and over time. “What is happening” seems unhelpfully broad, particularly given the complexity of enterprise infrastructures. It does, however, reflect the wide range of value an effective infrastructure monitoring platform can deliver. Because the IPM platform “understands” your environment by correlating all the data and applying artificial intelligence and/or machine learning, it can detect changes and anomalies, alert you to certain conditions, perform root cause analysis, and provide actionable recommendations for improvement. All of this enables problem resolution, performance management, availability and utilization maximization, resource optimization, and more.
Given this outsized role an infrastructure monitoring system has the potential to play for your organization, how do you find the right monitoring solution that will deliver? Here are some key characteristics to look for.
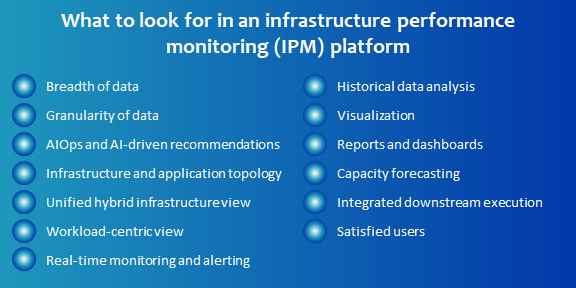
Breadth of data
Coverage is critical to giving you “eyes” throughout your entire infrastructure. This means you want data from the widest range of elements—compute, network, storage, software-defined/converged, wire, ecosystem, etc.—and multiple vendors across your entire technology stack.
Granularity of data
The volume of data generated is massive. Many tools deal with this by aggregating or averaging data points, for example, from microseconds to minutes. But this loss of data fidelity creates blind spots that can ultimately decrease the effectiveness of those tools. High-fidelity data maintains critical visibility.
AIOps and AI-driven recommendations
Gartner defines AIOps as the combination of “big data and machine learning to automate IT operations processes, including event correlation, anomaly detection, and causality determination.” Leveraging AI enables you to gain more insight and make better decisions for your infrastructure.
Infrastructure and application topology
To maintain an up-to-date view, your IPM platform needs to be able to discover and map services across your infrastructure. This includes understanding where applications are deployed, their business importance, how they utilize infrastructure, real-time service levels, and changes.
Unified hybrid infrastructure view
Enterprises today are managing hybrid infrastructures, which means that your IPM platform needs to provide you with a unified view of that entire environment. Anything else is simply a partial solution, which limits its value.
Workload-centric view
Workloads are what deliver value to the enterprise, and each workload uses or interacts with different systems and services across the infrastructure. By taking a workload-centric approach, rather than focusing on individual components, you can understand the health of your entire hybrid infrastructure.
Real-time monitoring and alerting
If you have specific mission-critical systems that don’t tolerate performance issues or downtime—because you will lose revenue, churn customers, or hurt your brand reputation—then intermittent or periodic data, no matter how frequently it’s updated, is unacceptable.
Historical data analysis
There is tremendous value in analyzing what has already happened so you can uncover patterns and trends that help you optimize, anticipate the effect of future changes, and better plan for evolving requirements.
Visualization
You want to be able to see the topology and end-to-end view of the infrastructure, its relationships, and status.
Reports and dashboards
To understand performance, capacity, and efficiency, all your stakeholders need to be able to get the information they need for their respective roles in an easily consumable way.
Capacity forecasting
This includes analyzing historical consumption to avoid capacity issues that will impact performance, stability, and budgets, as well as performing scenario-based projections to understand the capacity and budget implications of new projects and requirements.
Integrated downstream execution
Many of the alerts, insights, and recommendations that your IPM platform delivers require you to take action.
Integration with your ITSM governance tools and procedures ensures this happens more efficiently within your organization’s change processes.
Satisfied users
Finally, don’t overlook the experience others have had with any infrastructure monitoring platform you are evaluating. Who else is using it? What are the strengths they value the most? What was their experience working with the vendor, both pre- and post-sale?
Meet Virtana IPM
Virtana IPM, part of the Virtana Platform, is a fully integrated platform for performance and availability management with deep visibility, real-time data correlation, and actionable insights. It’s the only solution that combines massive ingest of wire, machine, and ecosystem data with AIOps, ML, and data-driven analytics and observability to ensure cost-effective performance and availability of your mission-critical hybrid infrastructure. With Virtana IPM, you get full-stack visibility to:
- Speed problem resolution across your hybrid environment
- Maximize availability
- Optimize application and infrastructure resources
Machine Learning in IPM
Introduction
In the previous articles in this series, we discussed the importance of infrastructure performance monitoring (IPM) and how to evaluate a platform to help you monitor your infrastructure, we detailed the types of metrics that are used, and we outlined what to look for in an effective infrastructure monitoring platform. In this article, we’ll delve into the topic of machine learning in IPM to explore how ML can be used to improve performance monitoring, the benefits of using ML in IPM, and how to incorporate ML into your infrastructure monitoring strategy.
Machine learning (ML), a subset of artificial intelligence that involves training algorithms to learn and make decisions based on data, feels like cutting-edge technology. So, it may surprise you to learn that the term “machine learning” was actually coined back in 1959 and that people have been training computers to learn since the 1960s. Of course, the technology has advanced significantly since then. Because ML can be used to identify patterns and anomalies in data, predict future issues, and improve overall monitoring effectiveness, it has been increasingly embedded throughout many aspects of the enterprise.
The use of machine learning in infrastructure performance monitoring
Machine learning is well-suited to IPM. ML is particularly useful when you can’t hand-code the rules. Because of the large number of factors in a complex enterprise infrastructure, ML enables you to predict outcomes or uncover trends that you otherwise would not be able to. And the volume of data generated about infrastructure performance, utilization, capacity, etc., up and down the tech stack is sufficiently large to enable machines to effectively learn the patterns they will use.
What are the benefits of using ML?
Machine learning enables you to build intelligence and automation into your infrastructure monitoring strategy to improve operations and performance in a variety of ways.
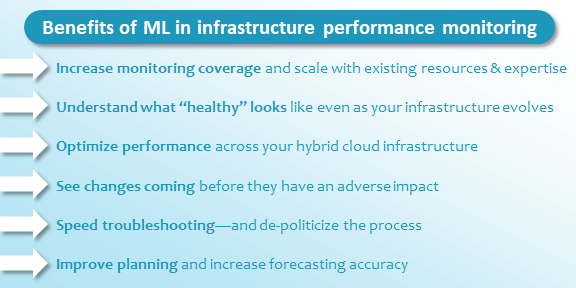
Increase monitoring coverage and scale with existing resources and expertise
ML is not a replacement for humans, but it does enable your team to increase its ability to have eyes on your entire hybrid cloud infrastructure at all times. Because an ML system can “understand” your hybrid cloud infrastructure in all its complexities, even your less experienced team members can more effectively maintain ongoing infrastructure performance. And because ML guides you to the areas that specifically need attention, it enables you to expand monitoring scope without requiring you to add headcount.
Understand what “healthy” looks like even as your infrastructure evolves
ML learns the baselines that reflect typical desired performance across your infrastructure. But that infrastructure isn’t static. You’re constantly adding new applications, equipment, and services, and at the same time, the “average” demand on resources may be evolving. Because the ML system continues to learn, it can keep up even in a highly dynamic environment.
Optimize performance across your hybrid cloud infrastructure
Understanding your baseline is essential, but just because that’s how things currently run doesn’t mean there isn’t room for improvement. ML can help you maximize the utilization of existing assets and ensure your application workloads are optimally balanced across your global infrastructure. This performance optimization helps make your baseline not only healthier but more efficient.
See changes coming before they have an adverse impact
Once you understand what the healthy baseline of your infrastructure looks like, anomaly detection becomes possible. This enables you to address a sudden problem in near-real time and is critical for downtime reduction. And because ML allows you to analyze massive volumes of data very quickly, it can identify and alert you to patterns and trends of concern, often even before they reach a critical point.
Speed troubleshooting—and de-politicize the process
Of course, nothing will be able to eliminate 100% of problems 100% of the time. Because an ML system enables you to understand interdependencies within complex infrastructures and “sees” the actual traffic, you can detect root cause quickly—in hours or minutes, compared to the days or even weeks it might take your team to track it down. It can also provide remediation suggestions, which can reduce the time it takes to fix the issue. And because root cause is based on data-driven evidence, you can sidestep all the finger-pointing and “it’s not my system, must be the other group’s fault” deflection that is frustrating and further delays resolution. In short, ML can help you reduce downtime.
Improve planning and increase forecasting accuracy
Capacity planning has typically been a judgment-based exercise. Not only is this somewhat arbitrary, but it uses a smaller range of factors by necessity, which can lower the accuracy of forecasts. The result is often overprovisioning, which wastes money, or underprovisioning, which results in bottlenecks and associated performance problems. ML-enabled infrastructure monitoring allows for data-driven decision making based on a much wider variety of inputs to ensure your infrastructure continues to meet your needs over time.
Implementing machine learning in your IPM strategy
So, now that we know why you want ML as part of your infrastructure performance monitoring and management strategy, the next question is how? You can, of course, build and train your own machine-learning algorithms. But this requires data science resources and expertise as well as a deep knowledge of all the various elements of your infrastructure that the ML will be learning and monitoring. Even if you have data scientists in house, they’re probably already spread too thin and need to focus on your core business. Furthermore, they will likely only have access to a limited data set to train the algorithms.
Instead, you can implement an advanced IPM platform to quickly and effectively incorporate machine learning into your infrastructure monitoring strategy—without the need for extensive up-front work or ongoing maintenance.
The future of hybrid IT management will come with an assist from machine learning
Machine learning has evolved from experimental to essential for business. The corner of the enterprise focused on infrastructure monitoring and management is no exception, particularly given the size, complexity, heterogeneity, and constant change of modern IT environments. These characteristics make it simply impossible for humans—no matter how large your team is or how many tools you have in place—to understand and effectively manage it all. ML is the key to keeping a large, dynamic, labyrinthine ecosystem healthy and optimized so it can serve the needs of the business right now and over time. And the most efficient way to do this is with an ML-enabled IPM platform.
Harness the power of ML with Virtana IPM
Virtana Infrastructure Performance Management (IPM), part of the Virtana Platform, is the only solution that combines massive ingest of wire, machine, and ecosystem data with AIOps, ML, and data-driven analytics and observability to ensure cost-effective performance and availability of your mission-critical hybrid infrastructure. Virtana IPM uses machine learning to:
- Detect anomalies in metrics, allowing for early identification and resolution of potential issues
- Power its recommendation engine, which helps you quickly resolve infrastructure performance issues
- Analyze seasonal workload trends to alert on deviation from historical behavior
- Recommend optimal application paths to storage to ensure multi-path failover
- Perform predictive time-to-zero analysis for existing capacity
- Rightsize workloads to ensure the highest possible compute utilization without impacting production
- Determine optimal queue depth settings to improve application host performance
Virtana’s ML is trained using data from hundreds of enterprise clients, giving it a wealth of experience and knowledge to draw from. By incorporating machine learning into its IPM platform, Virtana helps organizations optimize their monitoring efforts and improve the overall performance of their infrastructure.
What is APM?
Introduction
In IT, performance monitoring is the process of ensuring that all technology-based systems are meeting availability, service-level, budget, and other requirements of the enterprise. But there are different kinds of performance monitoring. In this article, which is part of a series on infrastructure performance monitoring (IPM), we discuss the difference between application performance monitoring (APM) and IPM and how the two can work together.
What is APM?
Application performance monitoring (APM) focuses on the behavior and performance of an application, its internal code structure components, and its supporting runtime environments, including the elements of the operating system on the servers that it’s deployed on. APM typically captures the user experience of the application or service, measuring internal code call or method response times, errors and load, and other metrics such as page requests, response time, database SQL query times, and queue depths. And they measure response times of the queue managers, database components, gateways, and utilization of physical and web-application servers. In short, APM tells you if the application is working well and, if not, tells you if the problem is in the code or runtime environment.
Who benefits from APM?
Any business that delivers applications to users needs to monitor the performance of those applications. APM tools are typically used by application support, operations, QA, and development teams to rapidly identify, isolate, and repair application issues. These teams usually have a basic level of understanding of how user networks or data center infrastructures operate, but not nearly the detailed knowledge required to resolve infrastructurerelated issues. They live and breathe application code, integration points, and component (server, OS, VM, JVM, etc.) metrics. They call in the network team when they think there is a network issue, or the virtualization and storage managers when they think it’s server- or storage-related.
APM limitations
Even if they are able to provide a single view of critical applications, APM tools often have limited value as they lack real-time visibility into how the application interacts with the supporting infrastructure components. Furthermore, they typically only instrument the top-tier applications, which represents just a small fraction of a company’s business applications. This means they have no visibility into secondary applications. Even worse, they can’t detect when secondary applications—so-called noisy neighbors—are affecting the APM-instrumented tier 1 applications.
Infrastructure problems cannot be sufficiently diagnosed with APM because those tools are largely blind beyond the virtual server they are deployed on, with no visibility into the storage network or storage arrays, for example. Although many APM vendors claim to be more broadly relevant, they simply can’t find or diagnose any but the simplest of infrastructure problems.
What is IPM?
Because of the limitations of APM tools, infrastructure performance monitoring solutions have emerged. Rather than focusing on just an application, IPM monitors the performance of the infrastructure—including physical, virtualized, and cloud environments—holistically across the entire IT ecosystem. Where APM focuses on the individual application and its operation, IPM looks at the full context in which the application is running, including cloud servers, operating systems, virtualization, and storage (including storage wire data, storage area networks, and software-defined storage). IPM also has multiple levels of application tiering to monitor and provide insight into the second, third, and fourth levels of application tiers.
Who benefits from IPM?
The more complex an organization’s IT infrastructure is, the more it needs IPM to monitor its wide variety of systems in real time to track availability, performance, and utilization of servers, networks, and storage—to minimize downtime, help prevent outages, and better plan for future upgrades.
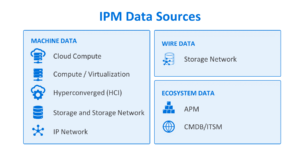
IPM data sources
To get an end-to-end view of the infrastructure, IPM uses data from a wide variety of sources. This includes machine data—i.e., log files stored on servers—for cloud compute, compute/virtualization, hyperconverged (HCI), storage and storage network, and IP network performance and capacity metrics. It also uses wire data, which is the communication between different elements in the environment, for performance and health metrics. And it also uses ecosystem data, such as from CMDB/ITSM tools and, yes, even APM tools.
IPM use cases
Problem resolution can be challenging in complex environments with lots of dynamic components. When there’s a performance issue, or worse, a failure, it can be tough to track down the cause of a problem among dozens, hundreds, or even more potential culprits. Is it caused by a CPU utilization event? Or how workloads are balanced across the infrastructure? Or flow control on a storage port? Or high queue depth? IPM can help you quickly track down the offender so you can address it and get back to normal operation faster.
IPM benefits aren’t limited to application performance problem resolution. It can also provide workload balancing to help you determine optimal placement of new VMs, perform capacity planning for VM CPU utilization, assure application service by identifying workload trends, and much more.
IPM limitations
While IPM addresses some of the shortcomings of APM, it’s not without limitations of its own. Traditional IPM solutions don’t have application awareness, which means they don’t understand how multiple workloads combine to form a service, and multiple services combine to operate as an application from the end-user perspective.
The case for application-centric IPM
IPM is not a replacement for APM—they both play a critical role. And if IPM can help fill the gaps that APM can’t address, how can you address IPM’s limitations? The answer is with application-centric IPM. Application-centric IPM solutions enable you to manage the performance and availability of the entire infrastructure, from the application to the storage. By recording hundreds of metrics in real time, correlating time-relevant events across the infrastructure, and using advanced analytics to point to potential problems and optimization opportunities, IPM solutions provide visibility into IT infrastructure—if it’s working well and, if not, where the problem is located—enabling proactive risk management. More specifically, application centric IPM solutions:
- Continuously capture, analyze, and correlate system-wide heterogeneous infrastructure performance, as measured by response time with utilization and health metrics, in real time.
- Provide a vendor-independent and comprehensive view of system-wide performance—from client to server to network to storage—in the context of the application being serviced by the infrastructure.
- Understand the relative business value and priority of the applications being supported by the infrastructure.
- Go beyond simply gathering and presenting metrics in a dashboard, which is insufficient to prevent performance problems and outages, and instead use a predictive analytics framework for contextual understanding, discovery, and real-time data correlation.
- Understand how applications are stressing the infrastructure and provide definitive insights that are both accurate and actionable by the operations and engineering teams.
- Can scale to handle a massive number of physical devices and the associated metrics without the risk of hitting a limit.
How Virtana’s IPM platform combines APM and IPM
Virtana Infrastructure Performance Management, part of the Virtana Platform, is the industry’s leading application-centric IPM platform, empowering IT staff with observability to deliver on the complex requirements of the infrastructure supporting their mission-critical applications and ensuring IT infrastructure health. Virtana IPM provides vendor-independent insights into the performance and availability of the end-to-end infrastructure across physical, virtual, and cloud environments. Virtana IPM intelligently correlates and analyzes an unmatched breadth and depth of data, transforming it into answers and actionable insights. This enables application and infrastructure teams to collaboratively promote and guarantee performance-based SLA. Application workload I/O profiling provides engineers and architects with essential insight to optimize cost and assure the performance of networked storage infrastructure, eliminating the risk and guesswork associated with changes, migrations, or consolidations. And Virtana IPM is the only solution that combines massive ingest of wire, machine, and ecosystem data with AIOps, machine learning (ML), and data-driven analytics to correlate and analyze an unprecedented breadth and depth of data, enabling IT managers to proactively manage performance, speed troubleshooting, reduced unplanned downtime, and achieve significant cost optimization across the infrastructure.
Virtana IPM provides:
- Infrastructure and application topology
- Discovery
- Service mapping
- Dashboards and reports
- Interactive topologies
- Alarm and incident management
- AI-powered analytics
- Anomaly detection
- Root cause analysis
- Capacity forecasting
- Workload analysis
- Workload balancing
- Workload sizing
- Workload placement
- Runbooks and collaboration
- Automated investigation workflows
- Streamlined change execution
Infrastructure Observability
Introduction
In this final article in our series about infrastructure performance monitoring (IPM), we cover the concept of observability and how, in addition to application and hybrid cloud monitoring, performance metrics, and other vital capabilities previously discussed, it’s a critical component of any IPM strategy.
What is infrastructure observability?
The concept of observability was introduced by Rudolf Kalman in 1960 in the context of linear dynamical systems. The term was then adopted in software to refer to the ability to collect data about an application program—its execution, the states of its internal modules, communication between components, etc.—using a variety of logging and tracing tools and techniques. The term’s use in infrastructure is similar, but instead of focusing on an application, it’s about understanding the state of your IT infrastructure as a whole. Today, this means you need outputs from all of the environments in your hybrid cloud infrastructure: on premises, public cloud, and private cloud.
Observability vs. monitoring
The terms “observability” and “monitoring” are sometimes used interchangeably, but there is a difference between the two. Monitoring is about gathering and understanding a pre-defined set of data. You’re watching the infrastructure to understand current state as it relates to those pre-defined metrics. Monitoring is often used to ensure system uptime and reliability and to avoid user-impacting outages.
Observability relies on monitoring but goes further to explore patterns and properties that are not defined in advance. This may, at first glance, seem to be a highly nuanced distinction, but it’s an important one. You can think of it this way: monitoring is what tells you something is wrong, while observability gives you the information to help you fix it. Or, to put it in other words, monitoring tells you about the condition of various elements in your infrastructure, but you need observability to get visibility into the health and performance of your entire infrastructure as one holistic environment. Observability is particularly important in modern enterprise IT environments where infrastructure components are distributed and managed through multiple abstraction layers.
Many infrastructure performance monitoring (IPM) tools, despite using only the term monitoring in their name, offer both monitoring and observability capabilities.
The role of log analysis and machine learning in observability
Logs are human-readable text files that capture the historical record of everything that happens within an IT system—transactions, errors, etc.—along with information about that event, such as time, associated users or endpoints, and other details that you’ve configured the system to capture. Log information comes from infrastructure and platform elements (network devices, servers, OSs, middleware, etc.), applications, and telemetry instrumented throughout the infrastructure. Because logs provide a comprehensive record of everything that happens with a resource, they are a crucial component of observability, particularly when paired with machine learning (ML).
Log files produce massive volumes of data. Because they record everything, they are inherently “noisy.” Furthermore, the varying logs throughout a diverse infrastructure ecosystem will provide different kinds of data. ML enables you to aggregate, correlate, and prioritize all that heterogenous data to filter out the noise and predict outcomes or uncover trends about infrastructure performance, utilization, capacity, etc. This provides deeper insight into the behavior of your infrastructure to identify performance bottlenecks, speed root cause analysis, and more.
The benefits of infrastructure observability
What does observability deliver that you can’t get with monitoring alone? The benefits are wide-ranging.
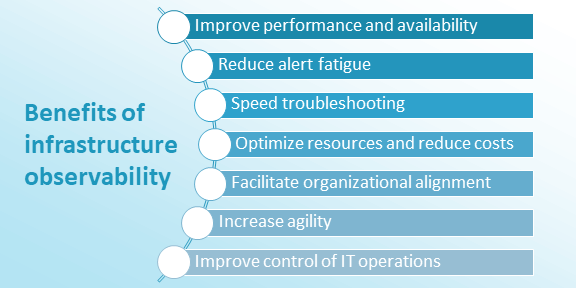
Improve performance and availability
A modern enterprise infrastructure has a lot of interrelated moving parts. Even small changes in one element can potentially have a cascading effect on performance and availability. Because an IPM platform with observability understands all the connections and dependencies—which monitoring alone can’t capture—it can identify and alert you to shifts that will lead to bottlenecks and other issues so you can address them before slowdowns or downtime affects users. It can even find opportunities to further boost performance beyond current levels.
Reduce alert fatigue
Alerts are critical to notify you that a system needs your attention. However, alert fatigue—the desensitization that happens as a result of an overwhelming number of alerts on a regular basis—is a real problem. An IPM platform with observability can help. By providing correlation, placing thresholds in context, and understanding patterns such as seasonality, it can reduce false alarms so you can focus on the indicators of real issues.
Speed troubleshooting
Even with improved performance and availability, there will always be unforeseen problems that arise. With so many interdependent services and resources within the infrastructure, it can be difficult and time-consuming to identify the source and then take the necessary steps to fix it. But with customer frustration, lost revenue, and other repercussions growing with every hour of downtime, you’re racing against a ticking clock. An IPM platform with observability can speed the time to resolution by identifying the root cause and recommending remediation actions. Even better, it can predict points of failure so you can address them before they happen.
Optimize resources and reduce costs
An IPM platform with observability can help you balance workloads optimally across your global infrastructure and maximize the utilization of your existing assets. This allows you to get more from your current resources, so you can keep your costs under control.
Facilitate organizational alignment
Monitoring is typically confined to specific resources or segments, and the information gathered tends to be more tactical and operational in nature. Because observability delivers full-stack visibility, it provides a common set of valuable insights and data, and can even tie it to business outcomes, which provides strategic value across a wider audience. It enables you to prioritize business decisions and understand the potential impact of those choices.
Increase agility
An IPM platform with observability that delivers an understanding of your entire infrastructure, including application topology and service mapping, enables you to adapt more easily to changing conditions and requirements without creating unintended consequences.
Improve control of IT operations
When you can connect your IPM platform with observability to your IT service management (ITSM) tools and processes, you can act on insights and recommendations quickly within your established change management workflows.
In addition to all of these capabilities, observability enables you to answer virtually any question you have about your hybrid cloud infrastructure, reducing uncertainty and risk.
Virtana IPM with observability delivers full-stack visibility
Virtana Infrastructure Performance Management (IPM), part of the Virtana Platform, is the only solution that combines massive ingest of wire, machine, and ecosystem data with AIOps, ML, and data-driven analytics to give you observability into the performance and availability of your hybrid cloud infrastructure. The fully integrated platform for performance and availability management delivers deep visibility, real-time data correlation, and actionable insights.