As an IT executive in manufacturing, you may be asked to produce KPIs, so managers may improve supply chain coordination, improve facilities and equipment maintenance and analyze manufacturing buffer incursions when projects exceed allotted times.

You might have used SAP ERP with Oracle or some other relational database but realized the benefits of moving to an in-memory database like SAP HANA. You brought in consultants with expertise in SAP, implemented HANA and now have real-time status reporting of inventories, a way to ask complex questions from SAP ERP or non-SAP systems on existing datasets at very high speed without any data-prep. Having done all this, why bother with infrastructure monitoring tools?
Alternately you could be an IT executive in an electric utility tasked with reducing the number of hours it takes for the month-end financial close of books, improving project cost capitalization or reducing IT TCO for an existing business data warehouse.
You might have used SAP ERP with Oracle or some other relational database but realized the benefits of moving to an in-memory database like SAP HANA. You brought in consultants with expertise in SAP, implemented HANA and now have real-time status reporting of inventories, a way to ask complex questions from SAP ERP or non-SAP systems on existing datasets at very high speed without any data-prep. Having done all this, why bother with infrastructure monitoring tools?

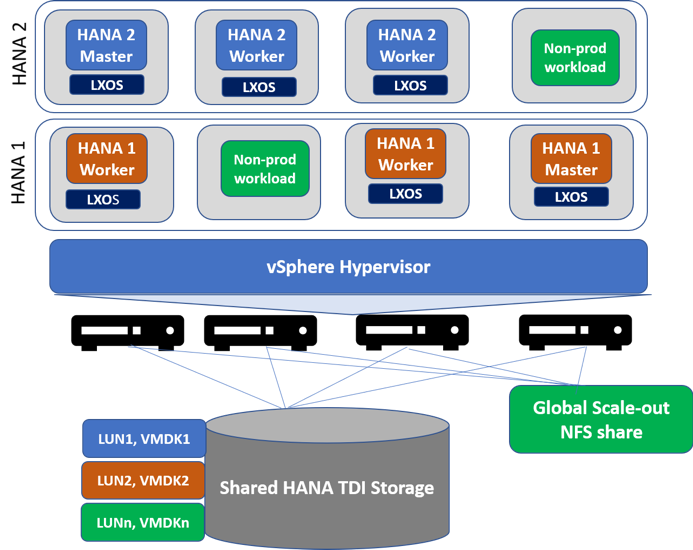
If SAP Business Warehouse (BW) is your reporting platform you have SAP BW application servers and HANA studio clients communicating with HANA servers deployed in a scale-out fashion on multiple physical servers and VMs. In this example, we consider VMware vSphere for server virtualization, but you could just as well be running HANA in dedicated LPARs on PowerVM hypervisors on IBM Power servers.
It is worth noting that while HANA runs in memory it still must persist data (on disk, flash or tape) for the database transaction guarantees in case of power outages and other factors which can cause data loss. A scale-out HANA deployment like the one shown above would use shared Tailored Datacenter Integration (TDI) storage for several reasons:
- SAP HANA installation (Binaries, install scripts, configuration files stored on NFS shares on NAS or possibly eNAS if you are using DellEMC VMAX storage arrays)
- Backup (regularly scheduled backup on network-attached storage accessed over NFS)
- Persistence data (Each HANA service writes changes to data in memory as savepoint blocks every 5 minutes to data volumes on LUNs on SAN-attached block storage)
- Re-do log (To ensure that the database can be recovered without data loss, each transaction by a HANA service is recorded in a redo log entry to log volumes on LUNs on SAN-attached block storage)
SAP prescribes that in a TDI installation every HANA node should have a BW of 400 MB/sec for peak use. If you have 10 HANA nodes connected via a Fibre Channel SAN to say an Dell EMC VMAX array, you’ll need a total BW of 4000 M/sec. If you assume that an 8 Gb/s front-end port provides ~ 750 MB/sec of BW, you’ll need to dedicate 6 of these 8 Gb/s front-end port to support 10 HANA nodes (6×750 MB/sec = 4500 MB/sec).
In addition, you must ensure that the entire path from the host through the SAN to the storage array can support the max BW of 400 MB/sec per HANA node. However, in the same SAN fabric, you have traffic from non-SAP workloads using the same or different shared storage arrays.
How do you ensure that a noisy neighbor running on some VM doesn’t impact the HANA instances?
Tools like SAP HANA Studio will help you manage the HANA installation inside the VM, monitoring tools from the SAN switch vendors (Brocade or Cisco) will monitor traffic at the ingress and egress on the SAN fabric, monitoring tools from your storage vendor will provide monitoring from a storage perspective. You need a vendor agnostic monitoring platform like VirtualWisdom to monitor end-to-end from the VM on the host to the LUN on the storage array especially when you are trying to identify noisy neighbors impacting the SLA of SAP HANA.
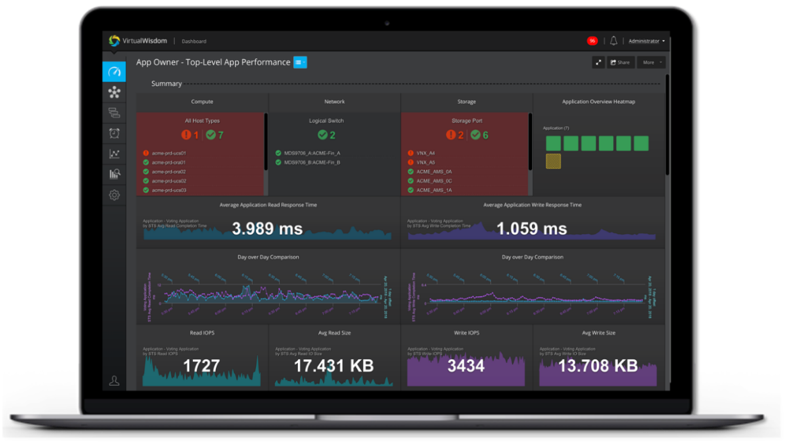
VirtualWisdom is an application-centric infrastructure monitoring platform used by multi-national manufacturing companies to identify the impact of shared infrastructure on applications from SAP. It uses the following workflow:
Problem identification: Applications are discovered and tiered. Alarms will fire based on predefined templates. Custom analytics can be run to ensure that multi-path and load balancing from the HANA hosts work as expected. While storage vendors like DellEMC may recommend that queue depth be set to 128 on the VMware ESXi host, our Queue Solver Analytic helps you ensure that queue depth of hosts are optimally set to ensure the highest throughput and best response times taking into account all other infrastructure in your datacenter.
Root cause analysis: We do this using custom analytics like Event Advisor and Trend Matcher.
Remediation: Recommendations provided by graphs generated by our custom analytics like VM Coordinator, queue solver, and storage port coordinator.
Verification: If you are using ServiceNow to track cases, when a case is closed, VirtualWisdom can verify if the problem in question was resolved.
Important Gotta-Have Information
Drop us a line and we’ll be in touch! Want to see where in the world we’ll be next? Check out our events page for a calendar of events we’re attending, and don’t forget to follow us on Twitter, LinkedIn, and Facebook to stay up to date on the latest and greatest in hybrid AIOps.
Virtana Insight