For teams managing GPU resources, high utilization is often seen as a primary goal. However, utilization metrics alone can be deceptive, masking significant inefficiencies. A GPU can be 100% utilized yet deliver a fraction of its potential throughput, leading to inefficient resource allocation and inflated operational costs, whether you are managing a large on-premises cluster or paying for powerful cloud instances. This translates directly into budget challenges: paying for powerful cloud instances that are not delivering value, extending project timelines, and ultimately hindering the return on a substantial capital investment. A more nuanced approach to performance analysis is required to understand if a GPU is not just busy, but genuinely productive.
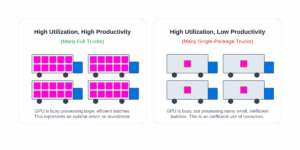
To illustrate, consider a delivery truck. A metric showing the truck is “on the road” 100% of the time is equivalent to GPU utilization; it tells us the truck is active. But this metric alone is insufficient. Is the truck at full capacity, or is it carrying a single small package? An active but empty truck still incurs costs for fuel, maintenance, and the driver’s salary, representing a poor return, regardless of whether you own the truck outright (on-prem) or are leasing it by the hour (cloud). To understand the efficiency of our delivery service, we also need a “load factor” metric. The same principle applies to GPUs; we must look beyond simple busy time to understand if our investment is actually generating value.
NVIDIA GPU Overview
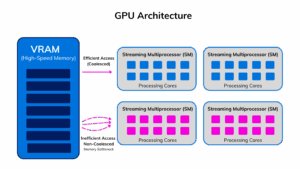
To properly assess GPU performance, we must first have a basic understanding of its core components. At a high level, a GPU’s architecture consists of thousands of processing cores organized into groups called Streaming Multiprocessors (SMs). These SMs are the computational workhorses of the GPU, containing not just the cores themselves but also schedulers and dedicated caches. However, for these workhorses to perform calculations, they need a constant supply of data, which is stored in the GPU’s dedicated high-speed memory (VRAM).
The relationship between the SMs and memory is critical and often the primary source of performance bottlenecks. The SMs execute instructions on data fetched from memory. If data is readily available and accessed in an optimal, contiguous pattern (coalesced access), the SMs can operate at high efficiency. Conversely, if the SMs must frequently wait for data to be transferred from memory—a condition known as a memory bottleneck—their computational power sits idle. This can happen if data access patterns are inefficient (non-coalesced), forcing many separate, slow memory transactions. Therefore, true efficiency is a function of both the computational activity within the SMs and the efficiency of the data pathways from memory.
Key Efficiency Metrics
To properly assess GPU performance, we must look at metrics that describe both activity and efficiency. While NVIDIA provides a comprehensive set of telemetry, and multiple metrics can be used, we focus on two fundamental metrics for this analysis: GPU Utilization and Streaming Multiprocessor (SM) Activity.
GPU Utilization: This metric measures the percentage of time during which at least one processing core on the GPU was active.
- What it indicates: Whether the GPU was processing a task versus being completely idle. It is a binary measure of activity.
- What it does not indicate: The intensity of the work. It fails to show how many SMs were in use, how effectively the active cores were loaded, or whether performance was constrained by factors like memory bandwidth. For instance, a single, inefficient kernel could activate one SM, registering 100% utilization for a brief period, while the other 99% of the GPU’s potential remains untouched.
SM Activity: This metric measures how effectively the SMs are being used. It reflects the ratio of executed instructions to the theoretical maximum the SMs could handle.
- What it indicates: The computational throughput of the active SMs. High SM activity is a strong proxy for high throughput, meaning many calculations are being completed per clock cycle.
- What it does not indicate: The percentage of time the GPU was active overall or the impact of bottlenecks outside the SMs, such as contention on the PCIe bus or network latency in a distributed computing environment.
By combining these two metrics, we can build a more accurate picture of GPU performance and its impact on your return on investment (ROI).
The Four Quadrants of GPU Performance
We can map GPU performance into four distinct states based on utilization and efficiency. Each quadrant has different underlying causes and cost implications.
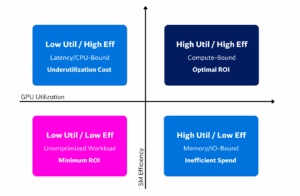
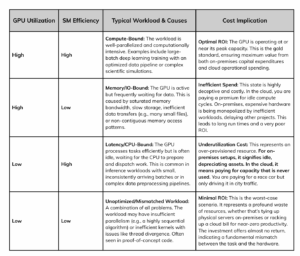
The quadrants in the image represent different GPU performance scenarios based on GPU utilization and SM (Streaming Multiprocessor) efficiency. The table below further elaborates on these quadrants, outlining typical workloads, potential causes, and cost implications for each.
Ultimately, the goal is to shift workloads from the less desirable quadrants into the High Utilization, High Efficiency state to maximize ROI.
Wrap Up
As you scale your GPU infrastructure, a clear understanding of both utilization and efficiency is necessary for making informed decisions. Relying on utilization as the sole indicator of performance is a common mistake that can obscure significant inefficiencies and lead to unnecessary hardware acquisitions or oversized, costly cloud instances. True performance management moves beyond simply keeping GPUs “busy” and instead focuses on ensuring they are genuinely productive.
A proactive strategy involves the continuous monitoring of both utilization and efficiency, mapped directly to specific applications. Virtana AI Factory Observability provides these critical insights, allowing you to move beyond simple metrics and instantly diagnose whether your GPUs are compute-bound or stalled by bottlenecks. With this understanding, your teams can make intelligent, data-driven decisions, distinguishing between a genuine need for more capacity and an opportunity to improve performance through optimization. This transforms infrastructure management from a reactive process to one that maximizes the value of every dollar spent and every GPU cycle.
High GPU utilization doesn’t equal high value. Stop guessing and start optimizing. Don’t just keep your GPUs busy—make them productive. Contact us today to see a demo of Virtana AI Factory Observability and unlock the true potential of your GPU investment.

Devin Avery
Principal Engineer