When AI models fail, it’s rarely the model’s fault. What slows things down, breaks training or Inference jobs, or drives up costs is almost always infrastructure.
In today’s AI-driven world, infrastructure complexity is growing faster than visibility. Models are no longer confined to research labs—they’re in production, distributed across hybrid environments, and touching nearly every aspect of the enterprise. And yet, too many organizations are flying blind. Their tools miss what’s happening beneath the surface, especially at the GPU level, where most of the AI heavy lifting takes place.
At Virtana, we’ve built our AI Factory Observability (AIFO) capabilities to close that gap. In this blog, we’ll go beyond the hype to show what observability actually looks like inside a modern AI factory—and why the only way to run AI at scale is to start by monitoring the infrastructure behind it.
The Market Has a Visibility Problem
The adoption curve for AI has outpaced most enterprises’ ability to operationalize it. AI workloads now span physical servers, containers, GPU clusters, high-performance storage, and complex orchestration systems. But most observability tools weren’t built for this. They monitor fragments—CPU performance, network throughput, or application errors—but they don’t correlate across layers or expose what’s happening deep inside the infrastructure.
This fragmentation creates blind spots that are hard to ignore:
- Why is this training job taking twice as long?
- Why are our GPUs underutilized?
- Why are we seeing inference latency spikes during off-peak hours?
- Why did a job fail after running perfectly for 10 hours?
Without full-stack visibility, these questions become guesswork. And that’s the problem we set out to solve.
It Starts with the GPU: Low-Level Telemetry That Matters
Modern AI runs on specialized hardware. Whether you’re using NVIDIA H100s, A100s, or older V100s, your AI performance is only as good as your ability to monitor and optimize those GPUs.
Virtana collects deep telemetry directly from GPU hardware and APIs, giving you actionable insight into:
- Utilization and memory usage
- Clock speeds and temperature
- ECC errors and tensor core activity
- Power consumption and throttling status
This isn’t vanity data. These are the metrics that tell you when your model is starved, your job is overheating, or your GPUs are idle when they shouldn’t be. These are the early warning signs that traditional monitoring tools miss—and that cause AI operations to stall or fail.
The Three Layers of the AI Factory
To get the full picture, you need observability across three interconnected layers. Here’s how Virtana delivers it:
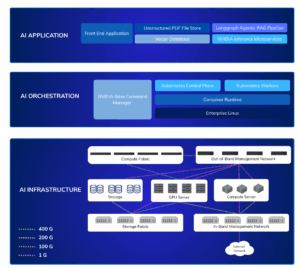
Figure 1: The AI Factory Blueprint is much more complicated than most IT teams realize, making it difficult to gain viability across all three AI layers.
1. Application Layer
This is where AI meets end users. Whether you’re running a summarization service, fraud detection model, or custom LLM pipeline, tracing is essential.

Figure 2: The AI Application layer often consists of front-end applications (Gadio, Python, API calls, etc.), unstructured PDF file store (NFS, S3, Hadoop, HTTP on PowerScale, etc.), vector database (e.g., Elastic on local block storage), LangGraph agentic RAG pipeline, and NVIDIA Inference Microservices (NIM) like NVIDIA Embedding NIM, NVIDIA Rerank NIM, and NVIDIA LLM Model NIM).
Using OpenTelemetry, we collect and visualize distributed traces that capture how requests flow through your services. For example, if a model takes 3x longer to respond than usual, we trace it through:
- The initial API request
- Each microservice hop
- The GPU-backed inference step
- Data reads and writes from storage
You can instantly see which component introduced latency, whether it was an application bug or an infrastructure bottleneck.
2. Orchestration Layer
Kubernetes, Slurm, and similar schedulers play a critical role in training and inference. But orchestration errors often go unnoticed.
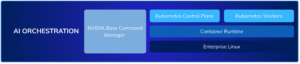
Figure 3: The AI Orchestration layer often consists of Kubernetes Workers (e.g., NVIDIA GPU Operator, NVIDIA Network Operator (optional), etc.), Kubernetes Control Plan, Container Runtime, Enterprise Linux, and NVIDIA Command Manager Essentials (also optional).
Virtana shows how your AI jobs are distributed, how long they run, whether pods restart, and whether resources are correctly allocated. We highlight misconfigurations, scheduling delays, and “straggler” nodes that can slow down distributed training pipelines.
If one job is taking 4x longer than expected, we’ll tell you whether the issue is job placement, resource starvation, or orchestration overhead.
3. Infrastructure Layer
This is where most tools fall short. Virtana delivers deep, correlated observability across the physical and virtual infrastructure powering your AI workloads:
- GPU hardware: Utilization, memory load, clock rates, power draw, thermal thresholds, ECC errors, and throttling indicators—from NVIDIA and other vendors
- Host-level metrics: CPU and memory saturation, disk I/O, thermal state, and node health across hybrid and bare-metal environments
- Network telemetry: Packet loss, port and switch failures, throughput trends, and congestion hotspots that can silently derail distributed training & inference
- Storage performance: Latency, IOPS, bandwidth, and access delays mapped to job-level input/output patterns
- Power consumption: Kilowatt-hour usage over time per workload, enabling both cost analysis and sustainability planning
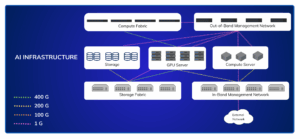
Figure 4: The AI Infrastructure layer includes GPU servers, CPU servers, in-band management networks, out-of-band management networks, external networks, storage, storage fabric, and compute fabric. Data transfer speeds between these components vary widely, ranging from 1G to 400G.
But metrics alone don’t solve problems. What makes Virtana different is our ability to correlate this telemetry with specific models, pods, and training jobs. You can move beyond just seeing that a GPU is running hot—you can identify which container initiated for that workload, what orchestration system placed it, and how it’s performing relative to baseline.
If a training job fails, you can trace the root cause back to a misconfigured pod, a throttled GPU, a failed switch port, or a storage bottleneck, all within the same interface.
This container-to-core visibility turns infrastructure observability from a diagnostic tool into an operational advantage.
Real-World Use Cases We See Every Day
These aren’t theoretical scenarios—they’re real problems we help customers solve:
- GPU Throttling Due to Thermal Load: A customer noticed degraded inference performance. We traced the slowdown to throttling caused by inadequate cooling. Fixing airflow increased model throughput without new hardware.
- Training Job Failure Due to Network Switch Port: A multi-node training job was failing unpredictably. The root cause? An intermittent failure in a top-of-rack switch port. Traditional monitoring never flagged it. Virtana did.
- Massive GPU Underutilization: In one environment, over 40% of GPU capacity was idle. Our visibility tools revealed poor orchestration and memory misallocation as the culprits.
- Inference Latency Tied to Storage I/O: During peak hours, a real-time AI application experienced delays. We correlated slow inference times to a backend storage system suffering from high IOPS and latency spikes.
- Power Optimization for AI Workloads: By exposing GPU power consumption patterns, we helped a customer reduce energy costs by lowering clock speeds on underutilized cards—cutting power use by 15%.
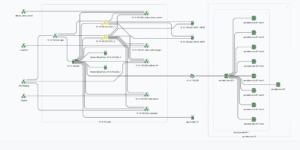
Figure 5: Unified observability across your entire AI factory, all in one actionable view.
Works with What You Have—Even Without High-End GPUs
Not every organization has racks full of H100s. Some are running smaller inference jobs on older GPU cards or CPUs. Others are deploying AI workloads entirely in the cloud on platforms like AWS, Azure, or GCP. Many are doing both.
Virtana supports them all.
You can deploy Virtana in the cloud, on-premises, or across hybrid environments. Our platform provides unified observability across wherever your AI workloads live—virtual machines, containers, GPU clusters, and cloud-native services.
Whether you’re a Fortune 50 enterprise managing hybrid GPU fleets or an R&D team running containerized models in the public cloud, Virtana helps you optimize performance, utilization, and cost, all without changing your architecture.
You don’t need to overhaul your stack to gain insight. And you certainly don’t need to buy more hardware before knowing how well you’re using what you already have.

Figure 6: A host overview showing GPU utilization, memory utilization, power usage, and GPU temperature.
Conclusion: You Can’t Optimize What You Can’t See
AI is not magic—it’s software running on infrastructure. And that infrastructure is full of moving parts, hidden bottlenecks, and costly inefficiencies.
Virtana AI Factory Observability gives you the tools to:
- Correlate infrastructure performance to AI workload behavior
- Identify and fix bottlenecks across the stack
- Reduce idle resources and wasted spend
- Accelerate root-cause analysis and recovery
- Make informed decisions about scaling, placement, and cost
You don’t have to guess where your problems are. You don’t have to chase symptoms. You can see exactly what’s happening, from the top-level application trace to the individual GPU core.
That’s what it means to run AI like a factory—and that’s where observability begins.

James Harper
Head of Product Marketing, Virtana