As the I.T. landscape continues to grow exponentially in complexity, complete and actionable observability is no longer optional — it’s essential. Why? Organizations require visibility into their systems to understand behavior, identify issues, maintain health, maintain optimal performance, and ensure overall reliability so that problems and outages do not eat into the organization’s bottom line nor affect organizational outcomes.
Enter OpenTelemetry (or OTel, for short).
OpenTelemetry is an open-source framework and software that offers a standardized way of collecting the “three pillars” of telemetry data—traces, metrics, and logs—across services and infrastructure.
Still, while OpenTelemetry provides a unified approach to telemetry collection, it’s important to understand both the advantages as well as gaps when leveraging this OTel framework. This will help organizations and their observability implementers to make informed implementation decisions.
This blog post will cover these advantages and the missing pieces (most of which are missing by design) of the OTel framework.
NOTE: While this post mainly references OTel, most points apply to other open-source telemetry collection technologies, such as Prometheus Exporters, Alloy, FluentD, and other OTel-compliant tracing libraries.
TL;DR
OpenTelemetry provides a powerful, vendor-neutral standard for collecting telemetry data in the form of traces, metrics, and logs, which frees organizations from vendor lock-in and unifies data collection across systems. However, it intentionally lacks backend capabilities, purposely not providing capabilities around data storage, visualization, advanced analytics, and alerting.
Virtana expertly fills these gaps by providing a comprehensive observability platform that seamlessly ingests OpenTelemetry data. It delivers not only critical storage and visualization capabilities but also advanced AI, ML, and curated-knowledge-driven analytics, automated root cause analysis, automated topology, orchestrated remediation, and hybrid infrastructure monitoring all via it’s Smart Layer, transforming the raw telemetry collected by OpenTelemetry into actionable insights and optimized performance.
The Pros of Using OpenTelemetry for Observability
Before understanding how to make the most out of OTel and solve its shortcomings, it’s important to first understand what it provides and the benefits an organization gains by leveraging it.
1. Unified Telemetry Collection for Traces, Metrics, and Logs
OpenTelemetry aims to cover all “three pillars” of observability—tracing, metrics, and logs—under a single specification.
Traces show a detailed view of how requests traverse through distributed systems. Metrics provide measurements of system health, state, and performance over time. And logs record events and errors. With the unified framework for collecting all three signal types, OTel enables a holistic collection of telemetry signals, which can then be correlated to each other and their underlying systems.
Why It’s Important:
The well-defined framework and OTel’s hyper-focused approach to collecting data reduce complexity in observability rollouts and add important context when debugging. Leveraging a single, common framework for data collection makes deployments more standardized and easier to manage.
Additionally, mixing and matching other non-unified and standardized technologies makes correlations between telemetry types difficult. Without this ability to see the whole unified picture, visibility is limited, and troubleshooting can become a time-consuming process of piecing together disparate and incomplete information.
2. Vendor-Neutral Instrumentation
One of the core tenets of OTel is that it is vendor-agnostic. OpenTelemetry is maintained by the Cloud Native Computing Foundation (CNCF) and has no vendor agenda in its mission statement. This is a markedly different approach to modern data collection. Traditional, vendor-provided collection mechanisms are often heavy, proprietary, expensive, and lead to vendor lock-in, along with difficulty integrating their signals between tools, even those within vendors’ same ecosystems. Leveraging OpenTelemetry provides the ability to use a standard framework and software modules where formats, source code, and even higher-level direction decision are openly defined and discussed.
Why It’s Important:
Vendor-neutrality functions as a catalyst for observability innovation without unnecessary challenges and likely also helps backend vendors keep their pricing fair. Additionally, vendor neutral data collection means not being tied to a vendor’s proprietary collection agents, SDKs, data formats, or being blindsided by a vendor’s unilateral decision to change the software’s capabilities or direction.
The commoditization of telemetry collection forces vendors to focus more on the value-add that they bring by layering smarts on top of the data, as opposed to just competing as to who can collect the most data.
3. Single or Multiple Sources to Single or Multiple Destinations
OpenTelemetry is designed to allow for sending telemetry data to a single destination or forked to send simultaneously to multiple destinations. This is a key capability of OTel and is managed, primarily, through the OpenTelemetry Collector.
The collector is configured with “exporters” as part of its data pipelines. Multiple exporters can be configured, each with their own destination or backend. As telemetry is ingested by the collector, it can then be transformed and fanned out to any number of exporters, routing the same data to various endpoints at once.
Why It’s Important:
The ability to collect data just once and leverage it many places provides many advantages, including reduced complexity, cost, and no vendor lock-in. In more detail, some of the benefits include:
Vendor Neutrality and Flexibility: As mentioned earlier in the blog, OTel gives you the freedom to choose, switch, or use multiple observability platforms without being locked into a single vendor.
Cost Management: Observability, with its high data volumes, can be expensive. The ability to send data to multiple destinations allows for significant cost optimization. For example, an organization can send their logs to a short-term, root-cause-analysis-enabled platform, like Virtana, for deep insights into problems. As the problems are resolved, those logs are no longer needed for immediate access. Those same logs can be simultaneously sent from the same source (OTel) to an ultra-low cost, long-term retention platform where they can be kept for compliance reasons as long as needed, at a fraction of the cost of a traditional observability vendor.
Support for Multiple Use Cases: In large organizations, different teams may have different tool preferences or usage requirements of the same data. The AI team might need data in a specific platform, while the SRE team relies on another for problem detection and resolution, and the Platform Engineering team may need the same data for capacity planning. OpenTelemetry allows organizations to serve all these teams and use cases from a single, standardized instrumentation source.
4. Extensive Language and Platform Support
OTel offers automatic instrumentation for most modern languages, including Go, Java, Python, JavaScript, .NET, and platforms, such as web frameworks, databases, message queues, and many more (Including easy Kubernetes Auto-Instrumentation). All of this is supported by very active development supported by many of the observability vendors and companies like Microsoft and Google, along with extensive community involvement and support.
Why It’s Important:
Time to instrumentation of applications and infrastructure across large, mixed-stack environments can be measured in minutes, instead of hours and days, thanks to extensive support and adoption of OpenTelemetry by application, platform, and infrastructure vendors. This ease of instrumentation leveraging a single framework makes management of observability data much simpler for the observability owners and reduces the time to value for organizations’ implementations of observability.
Gaps and Limitations in OpenTelemetry
Even with all its capabilities, OpenTelemetry is not a magical solution for the task of building a complete observability platform. For example, critical functions for a complete observability platform, like problem detection and dependency mapping, do not exist inside of OTel. This is by choice, as OTel exists to be a standardized, non-opinionated toolset for data collection. Additional analytical functions dependency mapping, correlation, and problem detection are all outside the scope of the project and are up to each organization to solve for.
Here are the key areas where gaps still exist:
1. Lack of Native Storage, Visualization, and Analytics Functions
OpenTelemetry is not a backend, dashboarding, or diagnostics tool. It defines and allows for generating and exporting telemetry data, but organization are responsible for integrating it with other tools and leveraging external analytical functions around it.
The table below shows what type of functions are handled by OTel, and which are handled by other platforms.
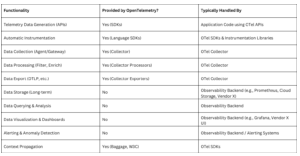
Implications:
Key components (like dashboarding and analytics) of an observability stack are purposefully left out so that the data collection and well-defined framework is always the core focus. You must still architect and maintain the storage, query, and visualization stack to leverage OTel.
How Virtana Helps:
Virtana is a full-fledged backend for OpenTelemetry and other open-source telemetry with all the key features needed for an observability stack implementation. That includes telemetry storage, AI/ML/curate-knowledge-based problem analytics, data dashboarding, and event/state-based remediation and orchestration.
2. Varying Levels of Maturity
While tracing and metrics are relatively mature, other capabilities, such as logging, RUM, and profiling, are still an evolving part of the specification and capabilities. For example, while the OpenTelemetry Collector is in use in production everywhere from small to extremely large organizations and other vendors even use components from it in their software, the collector itself has not officially reached 1.0 status.
Work continues on development and declaring the collector component generally available and on implementing the aforementioned capabilities, like profiling, but availability dates for many of these are still unclear.
Implication:
While organizations can leverage the components even as they’re still in ongoing development, changes to those components can mean unexpected or breaking behaviors in the way the data is collected, visualized, or used for analytics.
Additionally, organizations may prefer to leverage alternative data collectors, whether that be open-source or proprietary, e.g., Alloy for logs, or a vendor’s proprietary code profiling tool.
How Virtana Helps:
Virtana provides support not only for OpenTelemetry, but also for many additional telemetry sources, including data from both open-source and closed-source origins. Virtana can even handle the deployment of the underlying OpenTelemetry and open-source components so that work is offloaded from the organizations’ engineers. Virtana also constantly keeps up to date with new developments in OTel, so as specifications change, the platform also keeps up. Leveraging Virtana means organizations can move forward with OTel and other open-source projects confidently, knowing their choice will be supported as these projects evolve.
3. Operational Complexity
Setting up OpenTelemetry instrumentation and data collection, especially in large-scale production environments, can be non-trivial. Organizations need to manage pipelines, exporters, processors, and receivers carefully in order to get data from the proper sources, transform it, and export it to the appropriate backend(s).
Implication:
Organizations may face a steep learning curve as they move to open-source collection mechanisms. While extensive documentation and implementation examples exist, the deployment and integration of open-source observability projects are ultimately the responsibility of each organization and the vendors they choose. Some organization may not have the in-house expertise for utilization projects like OpenTelemetry, meaning they either must train engineers, hire engineers with the skillset, or rely on vendors.
How Virtana Helps:
Virtana embeds the rollout of many of the OpenTelemetry components into the deployment process. This way, organizations don’t have to deal with many of the large, architectural and procedural decisions involved with deploying open-source observability into application and infrastructure ecosystems.
Adopters of Virtana can move forward confidently with leveraging open-source observability software, knowing Virtana removes a lot of the complexity in installing and leveraging tools like OpenTelemetry.
Conclusion: A Strong Foundation Enhanced by Virtana
OpenTelemetry and other open-source telemetry collection tools will continue to reshape the observability landscape by offering a unified, vendor-neutral approach to data collection. For organizations looking to reduce lock-in and standardize observability across distributed systems, OpenTelemetry provides a lot of value.
However, adopting it still leaves gaps that must be resolved. Organizations still need to invest in backend tools, deal with operational complexity, and potentially extend features with commercial offerings or custom tooling.
Virtana remedies these gaps by providing a platform with full capabilities around unifying telemetry, problem detection, root cause analysis, dashboarding / data visualization, and built-in deployment mechanisms for open-source projects like OpenTelemetry, so organizations can gain value out of observability in minutes and re-focus on innovation for business outcomes and growing the bottom line.

Cesar Quintana
Virtana’s Director of Container Observability Strategy